To get started with the Data & Statistics application, add a Data & Statistics page to an existing document that contains a Lists & Spreadsheet page.
| 1. | Tap Add, and then tap  . . |
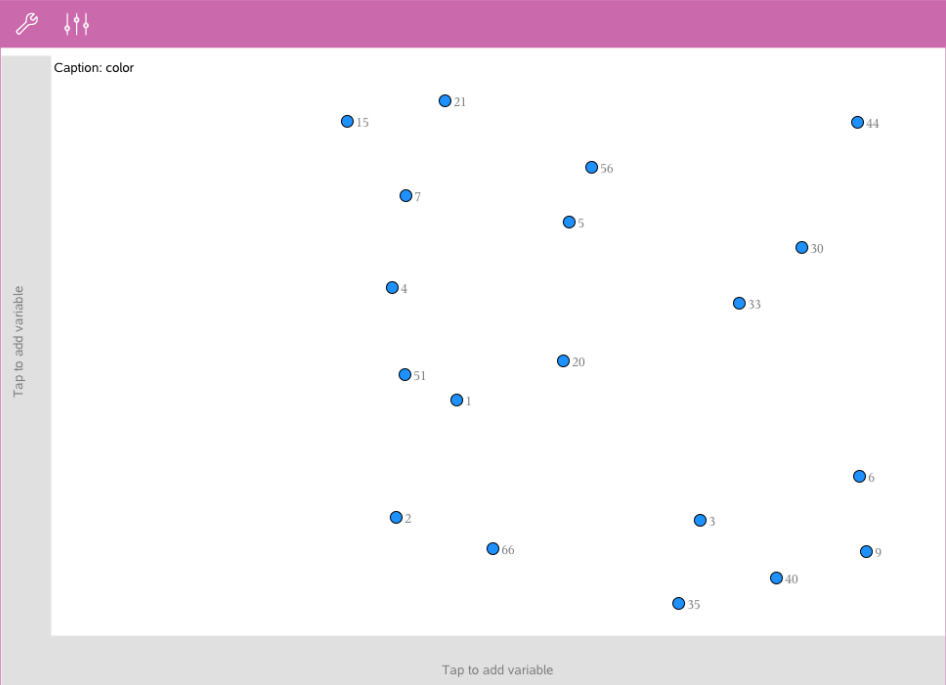
The Data & Statistics page shows the default caseplot.
| 2. | Tap the add variable region on each axis to view defined variables. |
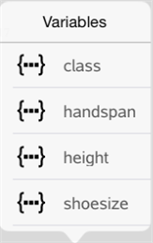
| 3. | Tap the variable name to add it to the selected axis to create a dot plot (frequency plot). |