|
Catalogue > |
|||||||
|
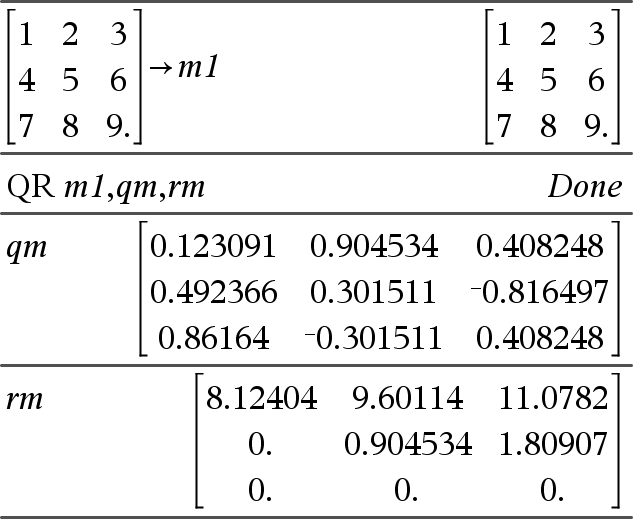
QR Matrix, qMatrix, rMatrix[, Tol] Calculates the Householder QR factorization of a real or complex matrix. The resulting Q and R matrices are stored to the specified Matrix. The Q matrix is unitary. The R matrix is upper triangular. Optionally, any matrix element is treated as zero if its absolute value is less than Tol. This tolerance is used only if the matrix has floating-point entries and does not contain any symbolic variables that have not been assigned a value. Otherwise, Tol is ignored.
|
The floating-point number (9.) in m1 causes results to be calculated in floating-point form.
|
||||||
|
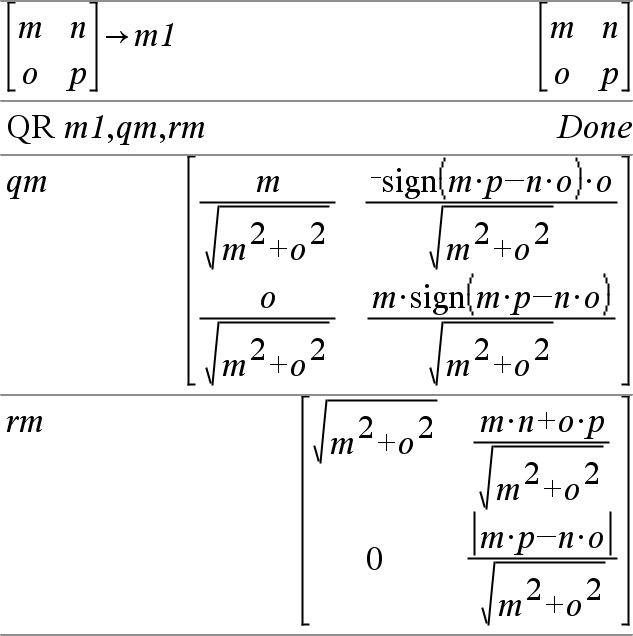
The QR factorization is computed numerically using Householder transformations. The symbolic solution is computed using Gram-Schmidt. The columns in qMatName are the orthonormal basis vectors that span the space defined by matrix. |
|
|
Catalogue > |
|
|
QuadReg X,Y [, Freq] [, Category, Include]] Computes the quadratic polynomial regressiony = a·x2+b·x+con lists X and Y with frequency Freq. A summary of results is stored in the stat.results variable (here). All the lists must have equal dimension except for Include. X and Y are lists of independent and dependent variables. Freq is an optional list of frequency values. Each element in Freq specifies the frequency of occurrence for each corresponding X and Y data point. The default value is 1. All elements must be integers | 0. Category is a list of category codes for the corresponding X and Y data. Include is a list of one or more of the category codes. Only those data items whose category code is included in this list are included in the calculation. For information on the effect of empty elements in a list, see “Empty (Void) Elements”, here. |
|
|
Output variable |
Description |
|
stat.RegEqn |
Regression equation: a·x2+b·x+c |
|
stat.a, stat.b, stat.c |
Regression coefficients |
|
stat.R2 |
Coefficient of determination |
|
stat.Resid |
Residuals from the regression |
|
stat.XReg |
List of data points in the modified X List actually used in the regression based on restrictions of Freq, Category List and Include Categories |
|
stat.YReg |
List of data points in the modified Y List actually used in the regression based on restrictions of Freq, Category List and Include Categories |
|
stat.FreqReg |
List of frequencies corresponding to stat.XReg and stat.YReg |
|
Catalogue > |
|
|
QuartReg X,Y [, Freq] [, Category, Include]] Computes the quartic polynomial regressiony = a·x4+b·x3+c· x2+d·x+eon lists X and Y with frequency Freq. A summary of results is stored in the stat.results variable (here). All the lists must have equal dimension except for Include. X and Y are lists of independent and dependent variables. Freq is an optional list of frequency values. Each element in Freq specifies the frequency of occurrence for each corresponding X and Y data point. The default value is 1. All elements must be integers | 0. Category is a list of category codes for the corresponding X and Y data. Include is a list of one or more of the category codes. Only those data items whose category code is included in this list are included in the calculation. For information on the effect of empty elements in a list, see “Empty (Void) Elements”, here. |
|
|
Output variable |
Description |
|
stat.RegEqn |
Regression equation: a·x4+b·x3+c· x2+d·x+e |
|
stat.a, stat.b, stat.c, stat.d, stat.e |
Regression coefficients |
|
stat.R2 |
Coefficient of determination |
|
stat.Resid |
Residuals from the regression |
|
stat.XReg |
List of data points in the modified X List actually used in the regression based on restrictions of Freq, Category List and Include Categories |
|
stat.YReg |
List of data points in the modified Y List actually used in the regression based on restrictions of Freq, Category List and Include Categories |
|
stat.FreqReg |
List of frequencies corresponding to stat.XReg and stat.YReg |


