|
Catalogue > |
|||||||||||||
|
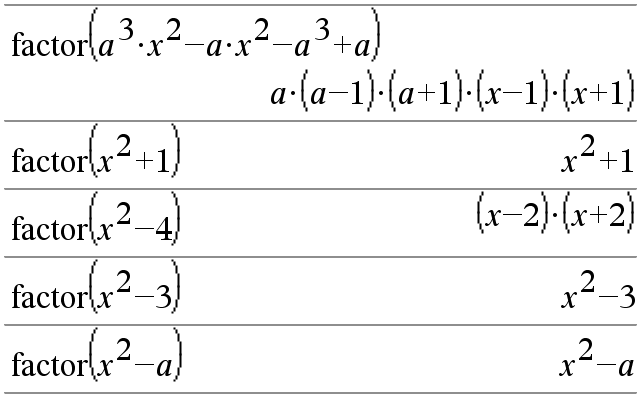
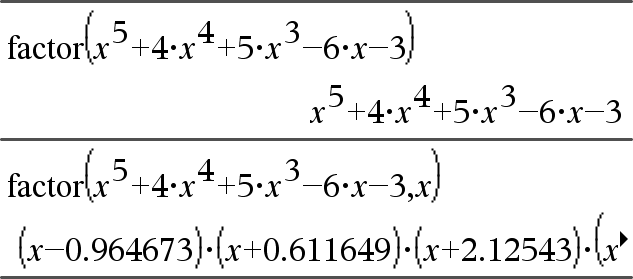
factor(Expr1[, Var])Þexpression factor(List1[,Var])Þlist factor(Matrix1[,Var])Þmatrix factor(Expr1) returns Expr1 factored with respect to all of its variables over a common denominator. Expr1 is factored as much as possible toward linear rational factors without introducing new non-real subexpressions. This alternative is appropriate if you want factorization with respect to more than one variable. |
|
||||||||||||
|
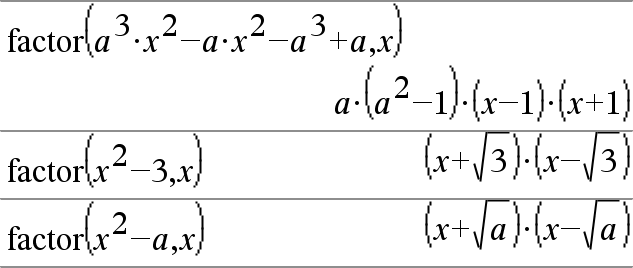
factor(Expr1,Var) returns Expr1 factored with respect to variable Var. Expr1 is factored as much as possible toward real factors that are linear in Var, even if it introduces irrational constants or subexpressions that are irrational in other variables. The factors and their terms are sorted with Var as the main variable. Similar powers of Var are collected in each factor. Include Var if factorization is needed with respect to only that variable and you are willing to accept irrational expressions in any other variables to increase factorization with respect to Var. There might be some incidental factoring with respect to other variables. |
|
||||||||||||
|
For the Auto setting of the Auto or Approximate mode, including Var permits approximation with floating-point coefficients where irrational coefficients cannot be explicitly expressed concisely in terms of the built-in functions. Even when there is only one variable, including Var might yield more complete factorization. Note: See also comDenom() for a fast way to achieve partial factoring when factor() is not fast enough or if it exhausts memory. Note: See also cFactor() for factoring all the way to complex coefficients in pursuit of linear factors. |
|
||||||||||||
|
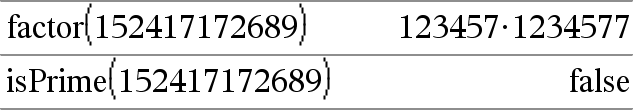
factor(rationalNumber) returns the rational number factored into primes. For composite numbers, the computing time grows exponentially with the number of digits in the second-largest factor. For example, factoring a 30-digit integer could take more than a day, and factoring a 100-digit number could take more than a century. To stop a calculation manually,
If you merely want to determine if a number is prime, use isPrime() instead. It is much faster, particularly if rationalNumber is not prime and if the second-largest factor has more than five digits. |
|

|
Catalogue > |
|
|
FCdf(lowBound,upBound,dfNumer,dfDenom)Þnumber if lowBound and upBound are numbers, list if lowBound and upBound are lists FCdf(lowBound,upBound,dfNumer,dfDenom)Þnumber if lowBound and upBound are numbers, list if lowBound and upBound are lists Computes the F distribution probability between lowBound and upBound for the specified dfNumer (degrees of freedom) and dfDenom. For P(X { upBound), set lowBound = 0. |
|
|
Catalogue > |
|
|
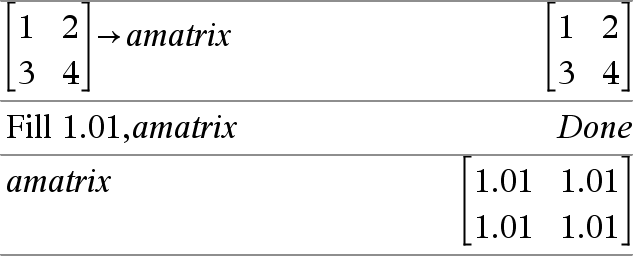
Fill Expr, matrixVarÞmatrix Replaces each element in variable matrixVar with Expr. matrixVar must already exist. |
|
|
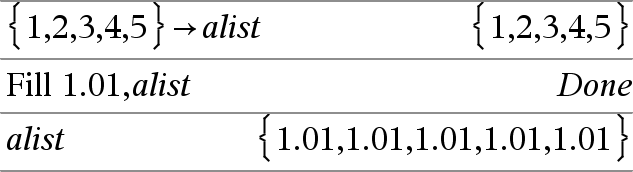
Fill Expr, listVarÞlist Replaces each element in variable listVar with Expr. listVar must already exist. |
|
|
Catalogue > |
|
|
FiveNumSummary X[,[Freq][,Category,Include]] Provides an abbreviated version of the 1-variable statistics on list X. A summary of results is stored in the stat.results variable (here). X represents a list containing the data. Freq is an optional list of frequency values. Each element in Freq specifies the frequency of occurrence for each corresponding X and Y data point. The default value is 1. Category is a list of numeric category codes for the corresponding X data. Include is a list of one or more of the category codes. Only those data items whose category code is included in this list are included in the calculation. An empty (void) element in any of the lists X, Freq, or Category results in a void for the corresponding element of all those lists. For more information on empty elements, see here. |
|
|
Output variable |
Description |
|
stat.MinX |
Minimum of x values. |
|
stat.Q1X |
1st Quartile of x. |
|
stat.MedianX |
Median of x. |
|
stat.Q3X |
3rd Quartile of x. |
|
stat.MaxX |
Maximum of x values. |
|
Catalogue > |
|
|
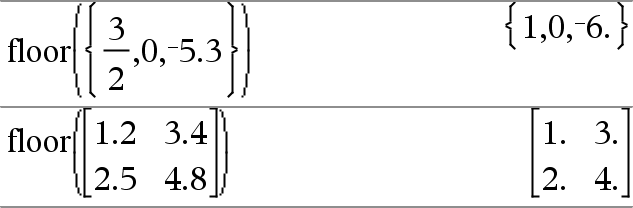
floor(Expr1)Þinteger Returns the greatest integer that is { the argument. This function is identical to int(). The argument can be a real or a complex number. |
|
|
floor(List1)Þlist floor(Matrix1)Þmatrix Returns a list or matrix of the floor of each element. Note: See also ceiling() and int(). |
|

|
Catalogue > |
|
|
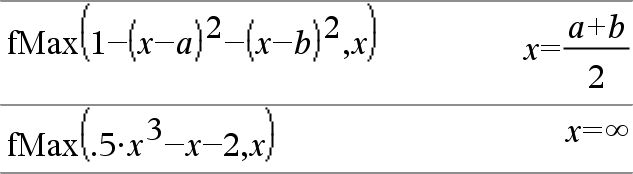
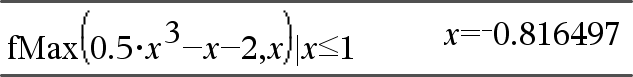
fMax(Expr, Var)ÞBoolean expression fMax(Expr, Var,lowBound) fMax(Expr, Var,lowBound,upBound) fMax(Expr, Var) | lowBound{Var{upBound Returns a Boolean expression specifying candidate values of Var that maximise Expr or locate its least upper bound. |
|
|
You can use the constraint (“|”) operator to restrict the solution interval and/or specify other constraints. For the Approximate setting of the Auto or Approximate mode, fMax() iteratively searches for one approximate local maximum. This is often faster, particularly if you use the “|” operator to constrain the search to a relatively small interval that contains exactly one local maximum. Note: See also fMin() and max(). |
|
|
Catalogue > |
|
|
fMin(Expr, Var)ÞBoolean expression fMin(Expr, Var,lowBound) fMin(Expr, Var,lowBound,upBound) fMin(Expr, Var) | lowBound{Var{upBound Returns a Boolean expression specifying candidate values of Var that minimise Expr or locate its greatest lower bound. You can use the constraint (“|”) operator to restrict the solution interval and/or specify other constraints. For the Approximate setting of the Auto or Approximate mode, fMin() iteratively searches for one approximate local minimum. This is often faster, particularly if you use the “|” operator to constrain the search to a relatively small interval that contains exactly one local minimum. Note: See also fMax() and min(). |
|

|
Catalogue > |
|
|
For Var, Low, High [, Step] Block EndFor Executes the statements in Block iteratively for each value of Var, from Low to High, in increments of Step. Var must not be a system variable. Step can be positive or negative. The default value is 1. Block can be either a single statement or a series of statements separated with the “:” character. Note for entering the example: For instructions on entering multi-line programme and function definitions, refer to the Calculator section of your product guidebook. |
|
|
Catalogue > |
|
|
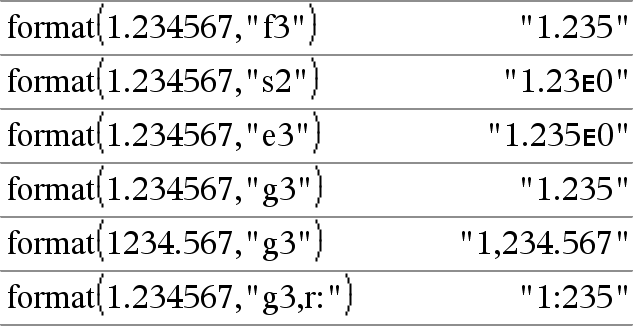
format(Expr[, formatString])Þstring Returns Expr as a character string based on the format template. Expr must simplify to a number. formatString is a string and must be in the form: “F[n]”, “S[n]”, “E[n]”, “G[n][c]”, where [ ] indicate optional portions. F[n]: Fixed format. n is the number of digits to display after the decimal point. S[n]: Scientific format. n is the number of digits to display after the decimal point. E[n]: Engineering format. n is the number of digits after the first significant digit. The exponent is adjusted to a multiple of three, and the decimal point is moved to the right by zero, one, or two digits. G[n][c]: Same as fixed format but also separates digits to the left of the radix into groups of three. c specifies the group separator character and defaults to a comma. If c is a period, the radix will be shown as a comma. [Rc]: Any of the above specifiers may be suffixed with the Rc radix flag, where c is a single character that specifies what to substitute for the radix point. |
|
|
Catalogue > |
|
|
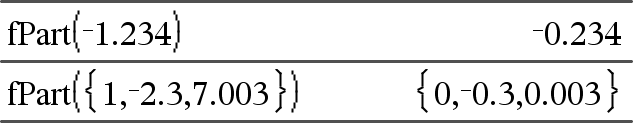
fPart(Expr1)Þexpression fPart(List1)Þlist fPart(Matrix1)Þmatrix Returns the fractional part of the argument. For a list or matrix, returns the fractional parts of the elements. The argument can be a real or a complex number. |
|
|
Catalogue > |
|
|
FPdf(XVal,dfNumer,dfDenom)Þnumber if XVal is a number, list if XVal is a list Computes the F distribution probability at XVal for the specified dfNumer (degrees of freedom) and dfDenom. |
|
|
Catalogue > |
|
|
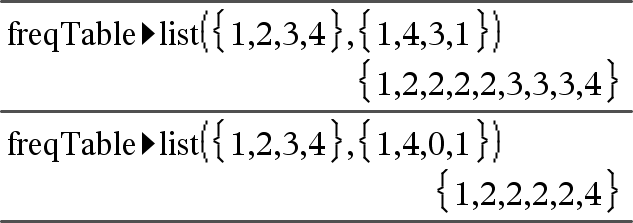
freqTable4list(List1,freqIntegerList)Þlist Returns a list containing the elements from List1 expanded according to the frequencies in freqIntegerList. This function can be used for building a frequency table for the Data & Statistics application. List1 can be any valid list. freqIntegerList must have the same dimension as List1 and must contain non-negative integer elements only. Each element specifies the number of times the corresponding List1 element will be repeated in the result list. A value of zero excludes the corresponding List1 element. Note: You can insert this function from the computer keyboard by typing freqTable@>list(...). Empty (void) elements are ignored. For more information on empty elements, see here. |
|
|
Catalogue > |
|
|
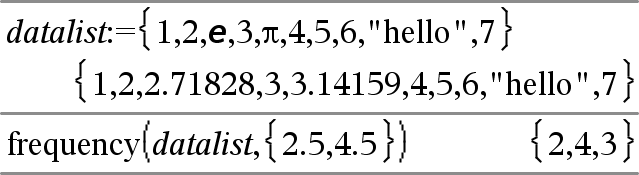
frequency(List1,binsList)Þlist Returns a list containing counts of the elements in List1. The counts are based on ranges (bins) that you define in binsList. If binsList is {b(1), b(2), …, b(n)}, the specified ranges are {?{b(1), b(1)<?{b(2),…,b(n-1)<?{b(n), b(n)>?}. The resulting list is one element longer than binsList. Each element of the result corresponds to the number of elements from List1 that are in the range of that bin. Expressed in terms of the countIf() function, the result is { countIf(list, ?{b(1)), countIf(list, b(1)<?{b(2)), …, countIf(list, b(n-1)<?{b(n)), countIf(list, b(n)>?)}. Elements of List1 that cannot be “placed in a bin” are ignored. Empty (void) elements are also ignored. For more information on empty elements, see here. Within the Lists & Spreadsheet application, you can use a range of cells in place of both arguments. Note: See also countIf(), here. |
Explanation of result: 2 elements from Datalist are {2.5 4 elements from Datalist are >2.5 and {4.5 3 elements from Datalist are >4.5 The element “hello” is a string and cannot be placed in any of the defined bins. |
|
Catalogue > |
|
|
FTest_2Samp List1,List2[,Freq1[,Freq2[,Hypoth]]] FTest_2Samp List1,List2[,Freq1[,Freq2[,Hypoth]]] (Data list input) FTest_2Samp sx1,n1,sx2,n2[,Hypoth] FTest_2Samp sx1,n1,sx2,n2[,Hypoth] (Summary stats input) Performs a two-sample F test. A summary of results is stored in the stat.results variable (here). For Ha: s1 > s2, set Hypoth>0 For information on the effect of empty elements in a list, see “Empty (Void) Elements”, here. |
|
|
Output variable |
Description |
|
stat.F |
Calculated F statistic for the data sequence |
|
stat.PVal |
Smallest level of significance at which the null hypothesis can be rejected |
|
stat.dfNumer |
numerator degrees of freedom = n1-1 |
|
stat.dfDenom |
denominator degrees of freedom = n2-1 |
|
stat.sx1, stat.sx2 |
Sample standard deviations of the data sequences in List 1 and List 2 |
|
stat.x1_bar stat.x2_bar |
Sample means of the data sequences in List 1 and List 2 |
|
stat.n1, stat.n2 |
Size of the samples |
|
Catalogue > |
|
|
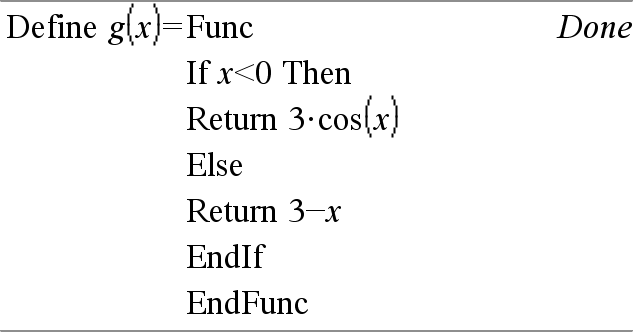
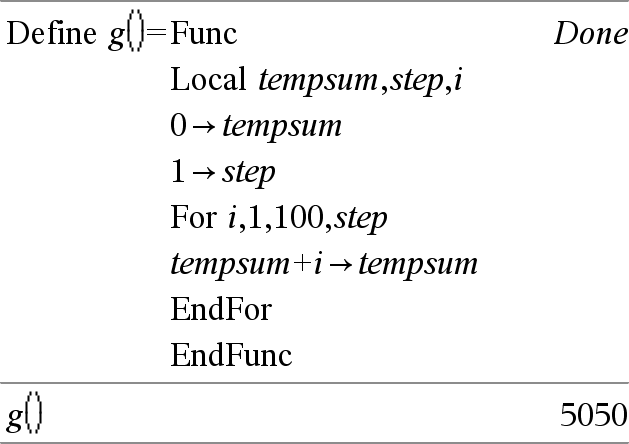
Func Template for creating a user-defined function. Block can be a single statement, a series of statements separated with the “:” character, or a series of statements on separate lines. The function can use the Return instruction to return a specific result. Note for entering the example: For instructions on entering multi-line programme and function definitions, refer to the Calculator section of your product guidebook. |
Define a piecewise function:
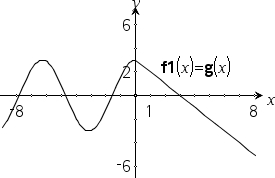
Result of graphing g(x)
|