You can configure a plot list for List questions, organize bar chart data and table views, individualize student responses, and organize Multiple Choice questions that have multiple responses into separate, group, or equivalent responses.
Configuring a Plot List
The plot list settings let you set different shapes for the different plots to help you follow separate lines or responses on a graph.
To set the plot list settings, follow these steps.
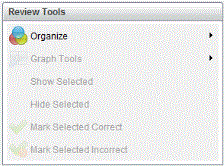
| 1. | While in graph view, click Graph Tools in the Review toolbox. |
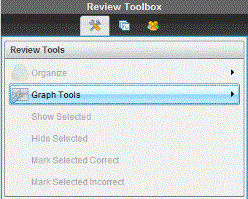
| 2. | Click Plot List Settings. |
The Configure Plot(s) dialog box opens.
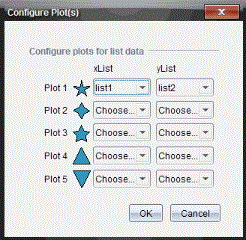
| 3. | Click the down arrow next to a shape to choose which list to represent (list1, list2, and so forth) for the xList and yList. |
Note: You can choose more than one shape for each list.
| 4. | Click OK. |
The graph view is updated with the shapes you selected.
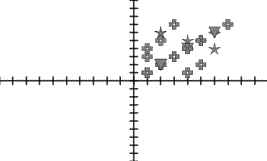
When you change plot list settings in the graph view, and then change to bar chart view, the software asks you to choose which lists to show in the bar chart. You can choose an individual list, or a list for the Category and Frequency.
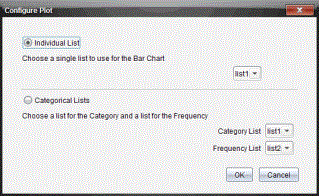
| 5. | Select the applicable options and click OK. |
If you click Cancel, the software shows the bar chart as an individual list, using list1 as the default.
You can configure the plot list at any time while in bar chart view.
Note: To configure the plot list from the bar chart view, click Organize in the Review toolbox and click Plot List Settings.
Individualizing Student Responses
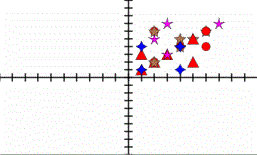
You can change the colors of each student response in a graph so you can identify the separate responses. This is useful when you are running a live activity; you can view the progress of individual students as they graph functions, move points on a graph, or respond to Quick Poll questions.
| ▶ | To change the color of student responses, click Graph Tools in the Review toolbox, and then click Individualize Student Responses. |
The responses are displayed in different colors in the Data View pane.
Organizing List Data
In bar chart view, you can organize list data by Frequency, Numeric Value, or Alphabetically.
To organize list data, follow these steps.
| 1. | In bar chart view, click Graph Tools. |

| 2. | Select to sort the bars by Frequency, Numeric Value, or Alphabetically. |
The bar chart view is updated in the Data View pane.
Organizing Bar Chart Data
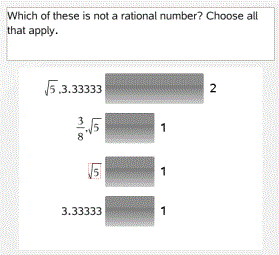
Organizing by separate responses shows the results for each individual response. For example, all of the A responses, all of the Bs, all of the Cs, and so forth. Organizing by group responses shows all multiple responses from the students. For example, all of the A plus B responses, all of the A plus C responses, and so forth.
Organizing by equivalency combines similar results into one bar. For example, y=4Mx, y=Mx+4, and y=M(xM4) would all be combined into one bar or table row.
By default, Multiple Response questions are displayed as separate responses in the bar chart view.
Settings for organizing by separate or group responses and for organizing by equivalency are retained when you close and reopen the Review Workspace.
To organize by grouped responses, follow these steps.
| 1. | Click the Organize tool in the Review toolbox. |
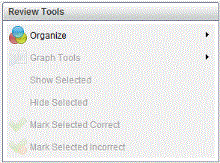
| 2. | Click Show Student Responses Grouped Together. |
The Data View pane shows the grouped responses.
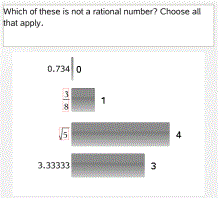
| 3. | To return to the default view, click the Organize tool, and then click Show Student Responses Separated. |
The Data View pane shows the data as separate responses.
Organizing by Equivalency
Organizing by equivalency groups all similar responses together in one bar or row. In bar chart view, you can still see separate responses by clicking on the bar.
To organize by equivalency, follow these steps.
| 1. | Click the Organize tool in the Review toolbox. |
| 2. | Click Group Responses by Equivalence. |
The Data View pane shows the grouped responses.
| 3. | To return to the default view, click the Organize tool, and then click Group Responses by Exact Matches. |
The Data View pane shows the data as separate responses.