Exploring Graphs with Path Plot
Path Plot lets you animate function, parametric, and polar equation plots in real time to analyze how they are plotted and not just the final plot.
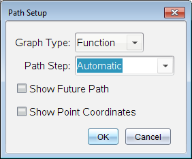
Changing the Path Plot Settings
|
1.
|
From the menu, select . |
|
2.
|
Select the settings you want to use. |
|
-
|
Selects Function, Parametric, or Polar as the graph type. |
|
-
|
Sets the increment of the independent variable at which values are plotted. |
|
-
|
Toggles the display of all future points for each function past the starting or current point of the graph. You can also toggle this when viewing the graph with the Up/Down arrow keys. |
|
-
|
Toggles the display of the coordinates for recorded trace points. |
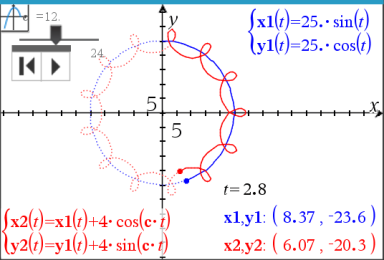
Enabling Path Plot
|
1.
|
Enter your equation(s). |
|
2.
|
From the menu, select . |
|
3.
|
Navigate through the animation by: |
|
-
|
using the Play/Pause/Reset Animation icons |
|
-
|
using the Left/Right arrow keys |
|
-
|
entering a number to jump to that point |
|
4.
|
Press the key to exit the animation. |