Changing Graphs & Geometry Settings
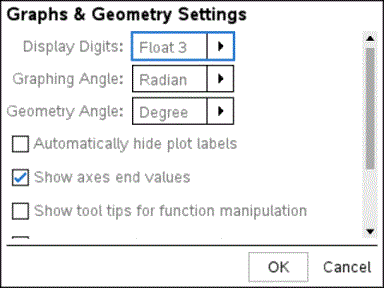
Graphs & Geometry settings control how information is displayed in open problems and in subsequent new problems. When you change the Graphs & Geometry settings, the selections become the default settings for all work in these applications.
Complete the following steps to customize the application settings for graphs and geometry.
|
1.
|
Create a new graphs and geometry document or open an existing document. |
|
2.
|
In the Documents Toolbox, click  to open the Graphs & Geometry application menu. to open the Graphs & Geometry application menu. |
The Graphs & Geometry Settings dialog box opens.

|
4.
|
Press or use your mouse to move through the list of settings. Click ¢ to open the drop-down list to view the available values for each setting. |
|
Display Digits
|
|
|
Graphing Angle
|
|
|
Geometry Angle
|
|
|
5.
|
Select the desired setting. |
|
6.
|
Select a check box to enable an option or clear a check box to disable an option. |
|
Automatically hide plot labels
|
Plot labels are displayed only when selected, grabbed, or hovered.
|
|
Show axis end values
|
A numeric label is displayed at the least and greatest values visible on an axis
|
|
Show tool tips for function manipulation
|
Shows helpful information as you manipulate function graphs
|
|
Automatically find a point of interest
|
Shows zeros, minima, and maxima for graphed functions and objects while tracing function graphs.
|
|
7.
|
Choose one of the following options: |
|
•
|
To apply the settings to the open document and to Scratchpad, and to make default for new Graphs and Geometry applications, click . |
|
•
|
Click to close the dialog box without making changes. |
