Table view provides another way to sort and view collected data.
| ▶ | Click the Table View tab |
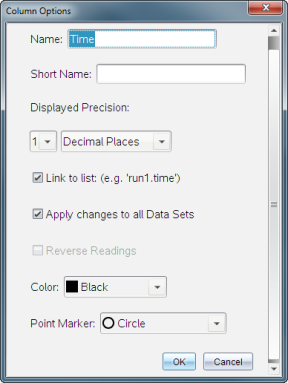
You can name columns and define the decimal points and the precision you want to use.
| 1. | from the Data menu, select Column Options. |
Note: You can be in the Meter, Graph, or Table view and still click these menu options. The results will still be visible.
| 2. | Click the name of the column you want to define. |
The Column Options dialog box opens.

| 3. | Type the long name for the column in the Name field. |
| 4. | Type the abbreviated name in the Short Name field. |
Note: This name is displayed if the column cannot expand to display the full name.
| 5. | Type the number of units in the Units field. |
| 6. | From the Displayed Precision drop-down list, select the precision value. |
Note: The default precision is related to the precision of the sensor.
| 7. | Select Link to list to link to the symbol table and make this information available to other TI-Nspire™ applications. |
Note: Linking is the default for most sensors.
Important: Heart rate and blood pressure sensors require a tremendous amount of data to be useful, and the default for these sensors is to be unlinked to improve system performance.
| 8. | Select Apply changes to all Data Sets to apply these settings to all data sets. |
| 9. | Click OK. |
The column settings are now defined with the new values.
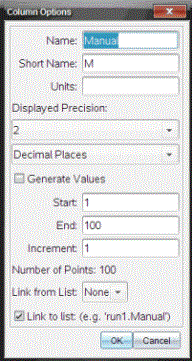
To enter data manually, add a new column. Sensor columns cannot be modified, but data entered manually can be edited.
| 1. | Click Data > New Manual Column. |
The Column Options dialog box opens.

| 2. | Type the long name for the column in the Name field. |
| 3. | Type the abbreviated name in the Short Name field. |
Note: This name is displayed if the column cannot expand to display the full name.
| 4. | Type the units to be used. |
| 5. | From the Displayed Precision drop-down list, select the precision value. |
Note: The default precision is related to the precision of the sensor.
| 6. | (Optional) Select Apply changes to all Data Sets to apply these settings to all data sets. |
| 7. | (Optional) Select Generate Values to automatically populate the rows. |
If you select this option, complete these steps:
| a) | Type a starting value in the Start field. |
| b) | Type an ending value in the End field. |
| c) | Type the increase in value in the Increment field. |
The number of points is calculated and shown in the Number of Points field.
| 8. | Select Link from list to link to data in another TI-Nspire™ application. |
Note: This list only populates when data exists in the other application and includes a column label.
| 9. | Select Link to list to link to the symbol table and make this information available to other TI-Nspire™ applications. |
Note: Linking is the default for most sensors.
Important: Heart rate and blood pressure sensors require a tremendous amount of data to be useful, and the default for these sensors is to be unlinked to improve system performance.
| 10. | Click OK. |
A new column is added to the table. This column can be edited.
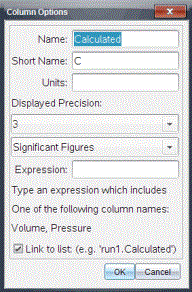
You can add an additional column to the data set in which the values are calculated from an expression using at least one of the existing columns.
Use a calculated column when finding the derivative for pH data. For more information, see Adjusting Derivative Settings.
| 1. | Click Data > New Calculated Column. |
The Column Options dialog box opens.

| 2. | Type the long name for the column in the Name field. |
| 3. | Type the abbreviated name in the Short Name field. |
Note: This name is displayed if the column cannot expand to display the full name.
| 4. | Type the units to be used. |
| 5. | From the Displayed Precision drop-down list, select the precision value. |
Note: The default precision is related to the precision of the sensor.
| 6. | Type a calculation including one of the column names in the Expression field. |
Note: The system-provided column names are dependent on the sensor(s) selected and any changes made to the name field in Column Options.
Important: The Expression field is case-sensitive. (Example: “Pressure” is not the same as “pressure.”)
| 7. | Select Link to list to link to the symbol table and make this information available to other TI-Nspire™ applications. |
Note: Linking is the default for most sensors.
Important: Heart rate and blood pressure sensors require a tremendous amount of data to be useful, and the default for these sensors is to be unlinked to improve system performance.
| 8. | Click OK. |
The new calculated column is created.
 Selecting the Table View