Using Data Markers to Annotate Data
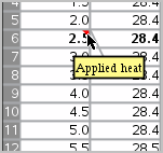
Data markers give you a way to emphasize specific data points, such as when you change a condition. For example, you might mark a point at which a chemical is added to a solution or when heat is applied or removed. You can add a marker with or without a comment, and you can hide a comment.
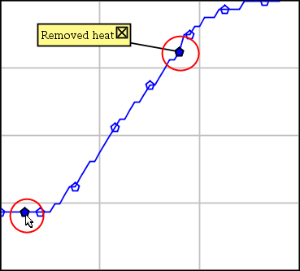
Two data markers, one with a comment displayed
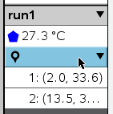
Marker shown as red triangle in Table view
|
▶
|
Click  to place a marker at the current data point. to place a marker at the current data point. |
|
1.
|
In Graph or Table view, click the point at which you want a marker. |
|
2.
|
Click . |
|
3.
|
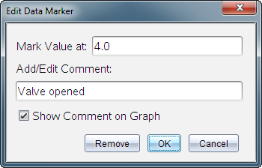
Complete the items in the dialog box. |
|
1.
|
In the Detail view, click to expand the list of markers for the data set. |
|
2.
|
Click the entry for the marker that you want to change, and complete the items in the dialog box. |
|
1.
|
Click to expand the list of markers in the Detail view. |
|
2.
|
Click the entry for the marker that you want to change. |
|
3.
|
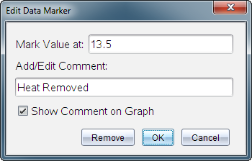
In the dialog box, type a new value for . |
|
▶
|
Drag the comment to move it. The connecting line remains attached to the data point. |
|
▶
|
Hide a comment by clicking the at the end of the comment. |
|
▶
|
To restore a hidden comment: |
|
a)
|
Click to expand the list of markers in the Detail view. |
|
b)
|
Click the entry for the marker that you want to change, and check . |
|
1.
|
Click to expand the list of markers in the Detail view. |
|
2.
|
In the dialog box, click . |
 Adding a Marker During Data Collection