|
Catalog > |
|
|
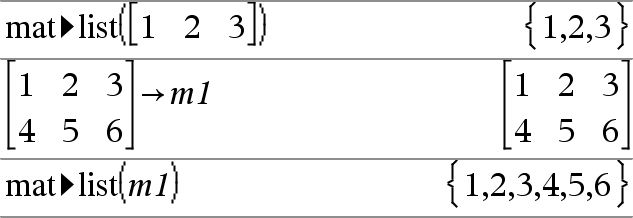
mat►list(Matrix) ⇒ list Returns a list filled with the elements in Matrix. The elements are copied from Matrix row by row. Note: You can insert this function from the computer keyboard by typing mat@>list(...). |
|
|
Catalog > |
|
|
Returns the maximum of the two arguments. If the arguments are two lists or matrices, returns a list or matrix containing the maximum value of each pair of corresponding elements. |
|
|
max(List) ⇒ expression Returns the maximum element in list. |
|
|
max(Matrix1) ⇒ matrix Returns a row vector containing the maximum element of each column in Matrix1. Empty (void) elements are ignored. For more information on empty elements, see here. Note: See also min(). |
|
|
Catalog > |
|
|
mean(List[, freqList]) ⇒ expression Returns the mean of the elements in List. Each freqList element counts the number of consecutive occurrences of the corresponding element in List. |
|
|
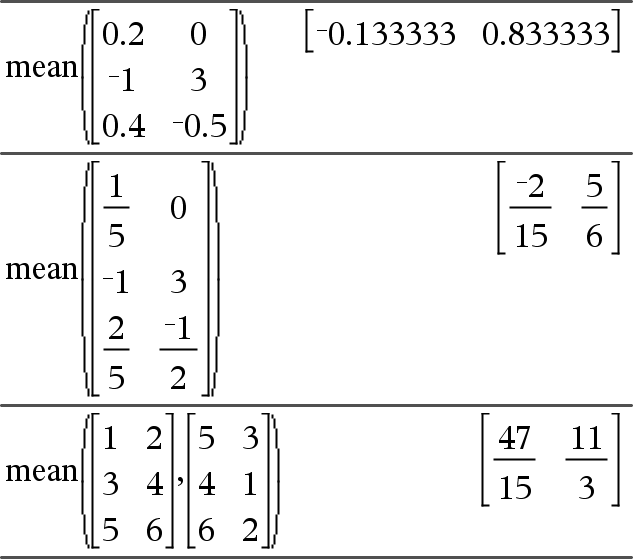
mean(Matrix1[, freqMatrix]) ⇒ matrix Returns a row vector of the means of all the columns in Matrix1. Each freqMatrix element counts the number of consecutive occurrences of the corresponding element in Matrix1. Empty (void) elements are ignored. For more information on empty elements, see here. |
In Rectangular vector format:
|
|
Catalog > |
|||||||
|
median(List[, freqList]) ⇒ expression Returns the median of the elements in List. Each freqList element counts the number of consecutive occurrences of the corresponding element in List. |
|
||||||
|
median(Matrix1[, freqMatrix]) ⇒ matrix Returns a row vector containing the medians of the columns in Matrix1. Each freqMatrix element counts the number of consecutive occurrences of the corresponding element in Matrix1. Notes:
|
|
|
Catalog > |
|
|
MedMed X,Y [, Freq] [, Category, Include]] Computes the median-median line y = (m•x+b) on lists X and Y with frequency Freq. A summary of results is stored in the stat.results variable. (See here.) All the lists must have equal dimension except for Include. X and Y are lists of independent and dependent variables. Freq is an optional list of frequency values. Each element in Freq specifies the frequency of occurrence for each corresponding X and Y data point. The default value is 1. All elements must be integers ≥ 0. Category is a list of Include is a list of one or more of the category codes. Only those data items whose category code is included in this list are included in the calculation. For information on the effect of empty elements in a list, see “Empty (Void) Elements,” here. |
|
|
Output variable |
Description |
|
stat.RegEqn |
Median-median line equation: m•x+b |
|
stat.m, stat.b |
Model coefficients |
|
stat.Resid |
Residuals from the median-median line |
|
stat.XReg |
List of data points in the modified X List actually used in the regression based on restrictions of Freq, Category List, and Include Categories |
|
stat.YReg |
List of data points in the modified Y List actually used in the regression based on restrictions of Freq, Category List, and Include Categories |
|
stat.FreqReg |
List of frequencies corresponding to stat.XReg and stat.YReg |
|
Catalog > |
|
|
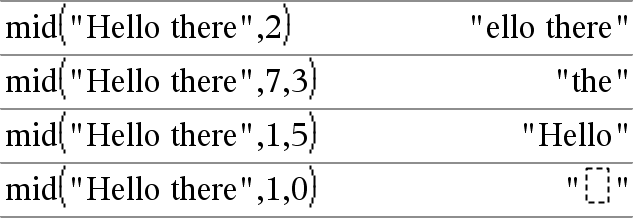
mid(sourceString, Start[, Count]) ⇒ string Returns Count characters from character string sourceString, beginning with character number Start. If Count is omitted or is greater than the dimension of sourceString, returns all characters from sourceString, beginning with character number Start. Count must be ≥ 0. If Count = 0, returns an empty string. |
|
|
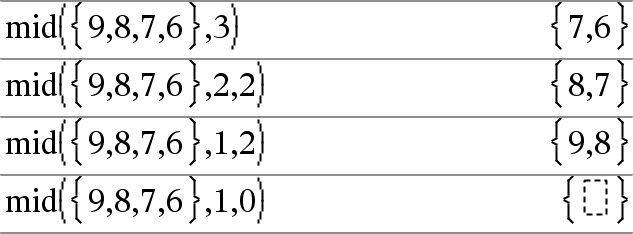
mid(sourceList, Start [, Count]) ⇒ list Returns Count elements from sourceList, beginning with element number Start. If Count is omitted or is greater than the dimension of sourceList, returns all elements from sourceList, beginning with element number Start. Count must be ≥ 0. If Count = 0, returns an empty list. |
|
|
mid(sourceStringList, Start[, Count]) ⇒ list Returns Count strings from the list of strings sourceStringList, beginning with element number Start. |
|
|
Catalog > |
|
|
Returns the minimum of the two arguments. If the arguments are two lists or matrices, returns a list or matrix containing the minimum value of each pair of corresponding elements. |
|
|
min(List) ⇒ expression Returns the minimum element of List. |
|
|
min(Matrix1) ⇒ matrix Returns a row vector containing the minimum element of each column in Matrix1. Note: See also max(). |
|
|
Catalog > |
|
|
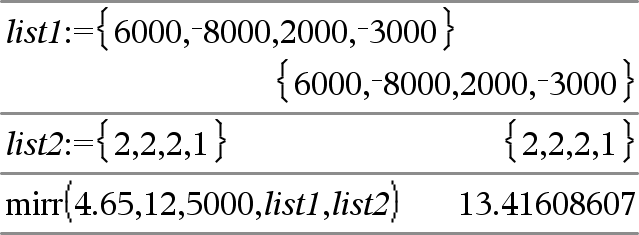
mirr(financeRate,reinvestRate,CF0,CFList[,CFFreq]) Financial function that returns the modified internal rate of return of an investment. financeRate is the interest rate that you pay on the cash flow amounts. reinvestRate is the interest rate at which the cash flows are reinvested. CF0 is the initial cash flow at time 0; it must be a real number. CFList is a list of cash flow amounts after the initial cash flow CF0. CFFreq is an optional list in which each element specifies the frequency of occurrence for a grouped (consecutive) cash flow amount, which is the corresponding element of CFList. The default is 1; if you enter values, they must be positive integers < 10,000. Note: See also irr(), here. |
|
|
Catalog > |
|
|
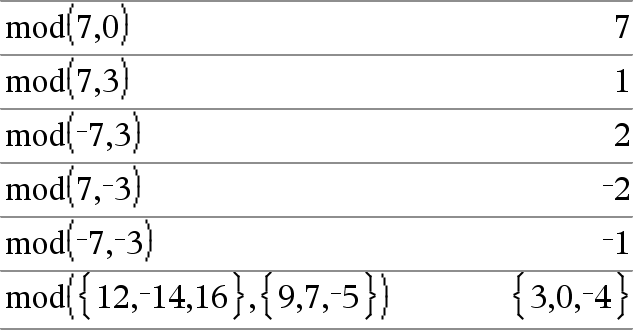
Returns the first argument modulo the second argument as defined by the identities: mod(x,0) = x When the second argument is non-zero, the result is periodic in that argument. The result is either zero or has the same sign as the second argument. If the arguments are two lists or two matrices, returns a list or matrix containing the modulo of each pair of corresponding elements. Note: See also remain(), here |
|
|
Catalog > |
|
|
mRow(Value, Matrix1, Index) ⇒ matrix
|
|
|
Catalog > |
|
|
mRowAdd(Value, Matrix1, Index1, Index2) ⇒ matrix Returns a copy of Matrix1 with each element in row Index2 of Matrix1 replaced with: Value • row Index1 + row Index2 |
|
|
Catalog > |
|
|
MultReg Y, X1[,X2[,X3,…[,X10]]] Calculates multiple linear regression of list Y on lists X1, X2, …, X10. A summary of results is stored in the stat.results variable. (See here.) All the lists must have equal dimension. For information on the effect of empty elements in a list, see “Empty (Void) Elements,” here. |
|
|
Output variable |
Description |
|
stat.RegEqn |
Regression Equation: b0+b1•x1+b2•x2+ ... |
|
stat.b0, stat.b1, ... |
Regression coefficients |
|
stat.R2 |
Coefficient of multiple determination |
|
stat.yList |
yList = b0+b1•x1+ ... |
|
stat.Resid |
Residuals from the regression |
|
Catalog > |
|
|
MultRegIntervals Y, X1[, X2[, X3,…[, X10]]], XValList[, CLevel] Computes a predicted y-value, a level C prediction interval for a single observation, and a level C confidence interval for the mean response. A summary of results is stored in the stat.results variable. (See here.) All the lists must have equal dimension. For information on the effect of empty elements in a list, see “Empty (Void) Elements,” here. |
|
|
Output variable |
Description |
|
stat.RegEqn |
Regression Equation: b0+b1•x1+b2•x2+ ... |
|
stat.y |
A point estimate: y = b0 + b1 • xl + ... for XValList |
|
stat.dfError |
Error degrees of freedom |
|
stat.CLower, stat.CUpper |
Confidence interval for a mean response |
|
stat.ME |
Confidence interval margin of error |
|
stat.SE |
Standard error of mean response |
|
stat.LowerPred, |
Prediction interval for a single observation |
|
stat.MEPred |
Prediction interval margin of error |
|
stat.SEPred |
Standard error for prediction |
|
stat.bList |
List of regression coefficients, {b0,b1,b2,...} |
|
stat.Resid |
Residuals from the regression |
|
Catalog > |
|
|
MultRegTests Y, X1[, X2[, X3,…[, X10]]] Multiple linear regression test computes a multiple linear regression on the given data and provides the global F test statistic and t test statistics for the coefficients. A summary of results is stored in the stat.results variable. (See here.) For information on the effect of empty elements in a list, see “Empty (Void) Elements,” here. |
|
Outputs
|
Output variable |
Description |
|
stat.RegEqn |
Regression Equation: b0+b1•x1+b2•x2+ ... |
|
stat.F |
Global F test statistic |
|
stat.PVal |
P-value associated with global F statistic |
|
stat.R2 |
Coefficient of multiple determination |
|
stat.AdjR2 |
Adjusted coefficient of multiple determination |
|
stat.s |
Standard deviation of the error |
|
stat.DW |
Durbin-Watson statistic; used to determine whether first-order auto correlation is present in the model |
|
stat.dfReg |
Regression degrees of freedom |
|
stat.SSReg |
Regression sum of squares |
|
stat.MSReg |
Regression mean square |
|
stat.dfError |
Error degrees of freedom |
|
stat.SSError |
Error sum of squares |
|
stat.MSError |
Error mean square |
|
stat.bList |
{b0,b1,...} List of coefficients |
|
stat.tList |
List of t statistics, one for each coefficient in the bList |
|
stat.PList |
List P-values for each t statistic |
|
stat.SEList |
List of standard errors for coefficients in bList |
|
stat.yList |
yList = b0+b1•x1+ . . . |
|
stat.Resid |
Residuals from the regression |
|
stat.sResid |
Standardized residuals; obtained by dividing a residual by its standard deviation |
|
stat.CookDist |
Cook’s distance; measure of the influence of an observation based on the residual and leverage |
|
stat.Leverage |
Measure of how far the values of the independent variable are from their mean values |

