TI-Nspire™ CX II - Draw Commands
This is a supplemental document for the TI-Nspire™ Reference Guide and the TI-Nspire™ CAS Reference Guide. All TI-Nspire™ CX II commands will be incorporated and published in version 5.1 of the TI-Nspire™ Reference Guide and the TI-Nspire™ CAS Reference Guide.
Graphics Programming
New commands have been added on TI-Nspire™ CX II Handhelds and TI-Nspire™ desktop applications for graphics programming.
The TI-Nspire™ CX II Handhelds will switch into this graphics mode while executing graphics commands and switch back to the context in which the program was executed after completion of the program.
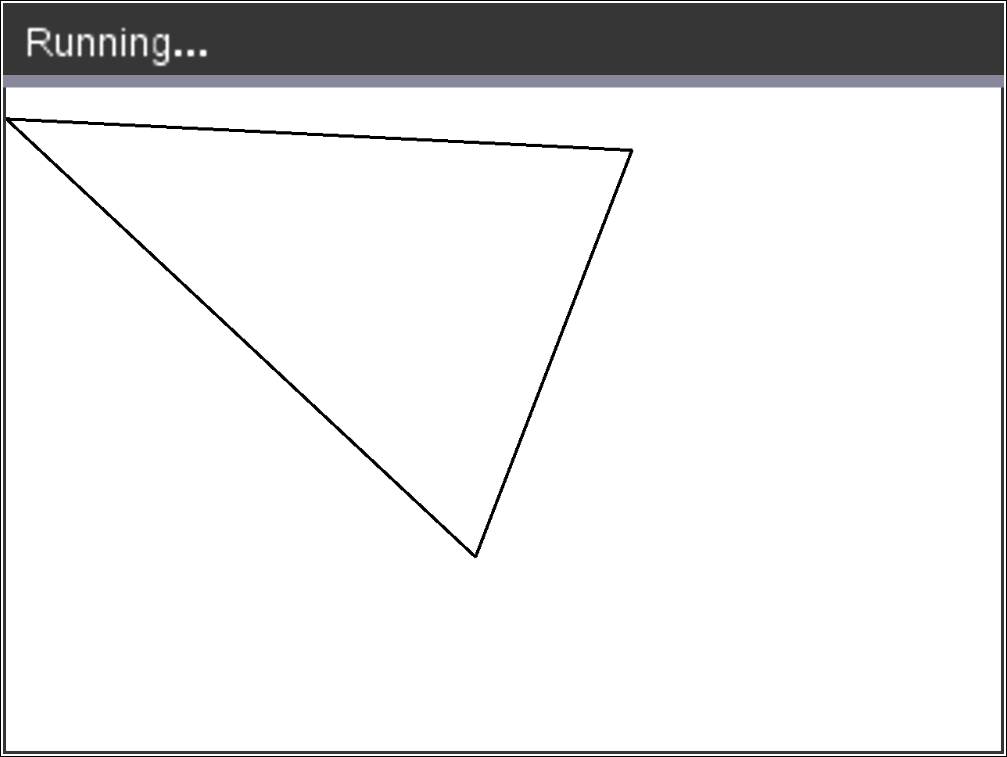
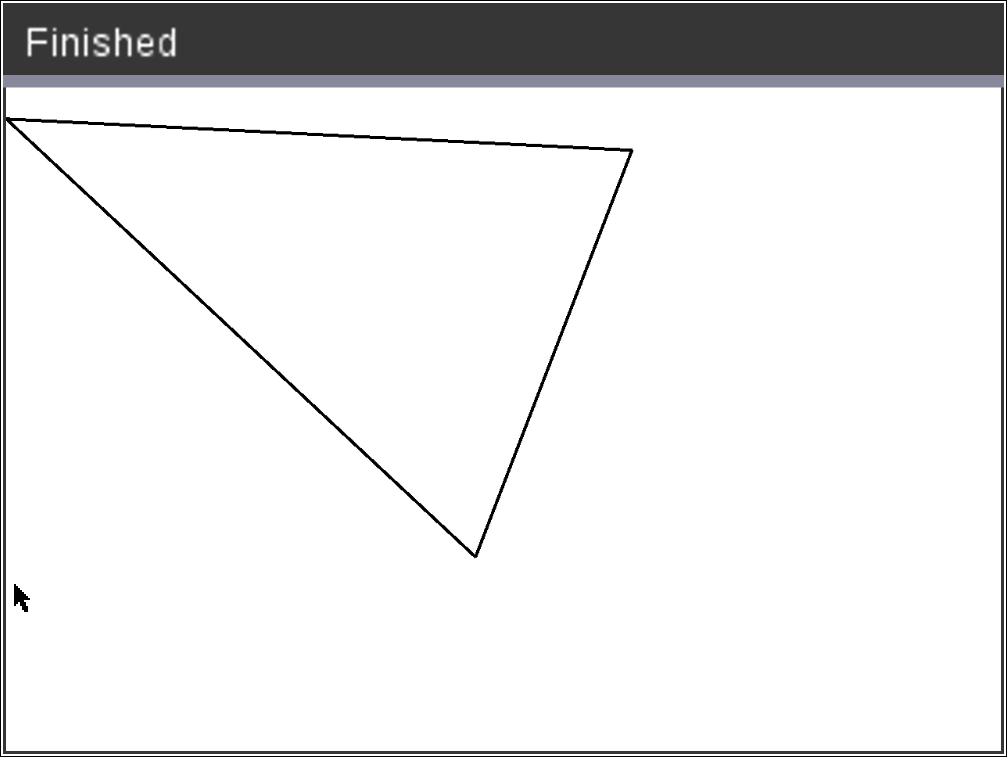
The screen will display “Running…” in the top bar while the program is being executed. It will show “Finished” when the program completes. Any key-press will transition the system out of the graphics mode.
| • | The transition to graphics mode is triggered automatically when one of the Draw (graphics) commands is encountered during execution of the TI-Basic program. |
| • | This transition will only happen when executing a program from calculator; in a document or calculator in scratchpad. |
| • | The transition out of graphics mode happens upon termination of the program. |
| • | The graphics mode is only available on the TI-Nspire™ CX II Handhelds and the desktop TI-Nspire™ CX II Handhelds view. This means it is not available in the computer document view or PublishView (.tnsp) on the desktop nor on iOS. |
| - | If a graphics command is encountered while executing a TI-Basic program from the incorrect context, an error message is displayed and the TI-Basic program is terminated. |
Graphics Screen
The graphics screen will contain a header at the top of the screen that cannot be written to by graphics commands.
The graphics screen drawing area will be cleared (color = 255,255,255) when the graphics screen is initialized.
|
Graphics Screen |
Default |
|---|---|
|
Height |
212 |
|
Width |
318 |
|
Color |
white: 255,255,255 |
Default View and Settings
| • | The status icons in the top bar (battery status, press-to-test status, network indicator etc.) will not be visible while a graphics program is running. |
| • | Default drawing color: Black (0,0,0) |
| • | Default pen style - normal, smooth |
| - | Thickness: 1 (thin), 2 (normal), 3 (thickest) |
| - | Style: 1 (smooth), 2 (dotted), 3 (dashed) |
| • | All drawing commands will use the current color and pen settings; either default values or those which were set via TI-Basic commands. |
| • | Text font is fixed and cannot be changed. |
| • | Any output to the graphics screen will be drawn within a clipping window which is the size of the graphics screen drawing area. Any drawn output that extends outside of this clipped graphics screen drawing area will not be drawn. No error message will be displayed. |
| • | All x,y coordinates specified for drawing commands are defined such that 0,0 is at the top left corner of the graphics screen drawing area. |
| - | Exceptions: |
| - | DrawText uses the coordinates as the bottom left corner of the bounding box for the text. |
| - | SetWindow uses the bottom left corner of the screen |
| • | All parameters for the commands can be provided as expressions that evaluate to a number which is then rounded to the nearest integer. |
Graphics Screen Errors Messages
If the validation fails, an error message will display.
|
Error Message |
Description |
View |
|---|---|---|
|
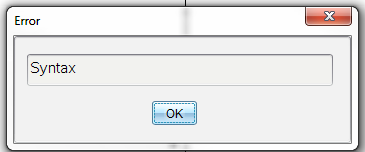
Error |
If the syntax checker finds any syntax errors, it displays an error message and tries to position the cursor near the first error so you can correct it. |
|
|
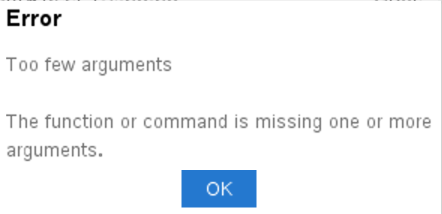
Error |
The function or command is missing one or more arguments |
|
|
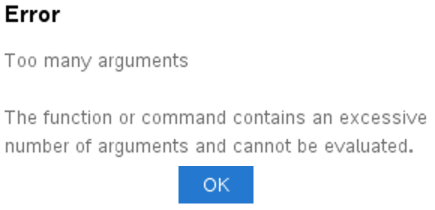
Error |
The function or command contains and excessive number of arguments and cannot be evaluated. |
|
|
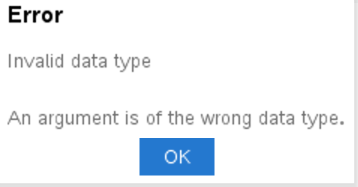
Error |
An argument is of the wrong data type. |
|
Invalid Commands While in Graphics Mode
Some commands are not allowed once the program switches to graphics mode. If these commands are encountered while in graphics mode and error will be displayed and the program will be terminated.
|
Disallowed Command |
Error Message |
|---|---|
|
Request |
Request cannot be executed in graphics mode |
|
RequestStr |
RequestStr cannot be executed in graphics mode |
|
Text |
Text cannot be executed in graphics mode |
The commands that print text to the calculator - disp and dispAt - will be supported commands in the graphics context. The text from these commands will be sent to the Calculator screen (not on Graphics) and will be visible after the program exits and the system switches back to the Calculator app
C
|
|
Catalog > |
|
Clear x, y, width, height Clears entire screen if no parameters are specified. If x, y, width and height are specified, the rectangle defined by the parameters will be cleared. |
Clear Clears entire screen
Clear 10,10,100,50 Clears a rectangle area with top left corner on (10, 10) and with width 100, height 50 |

D
|
|
Catalog > |
|
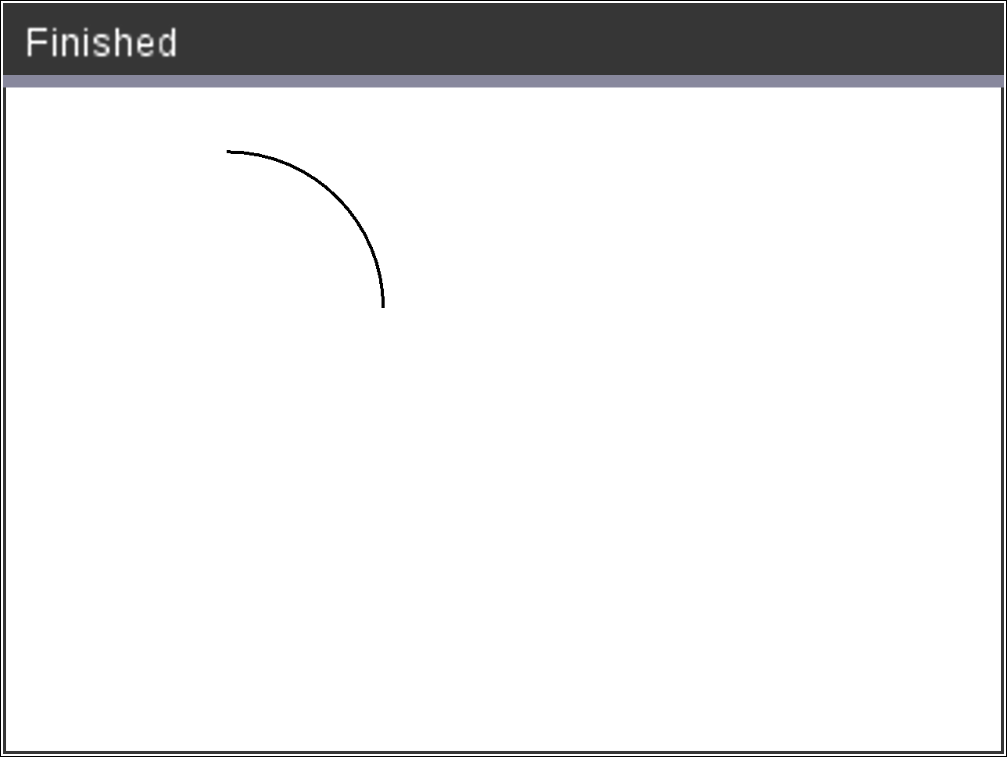
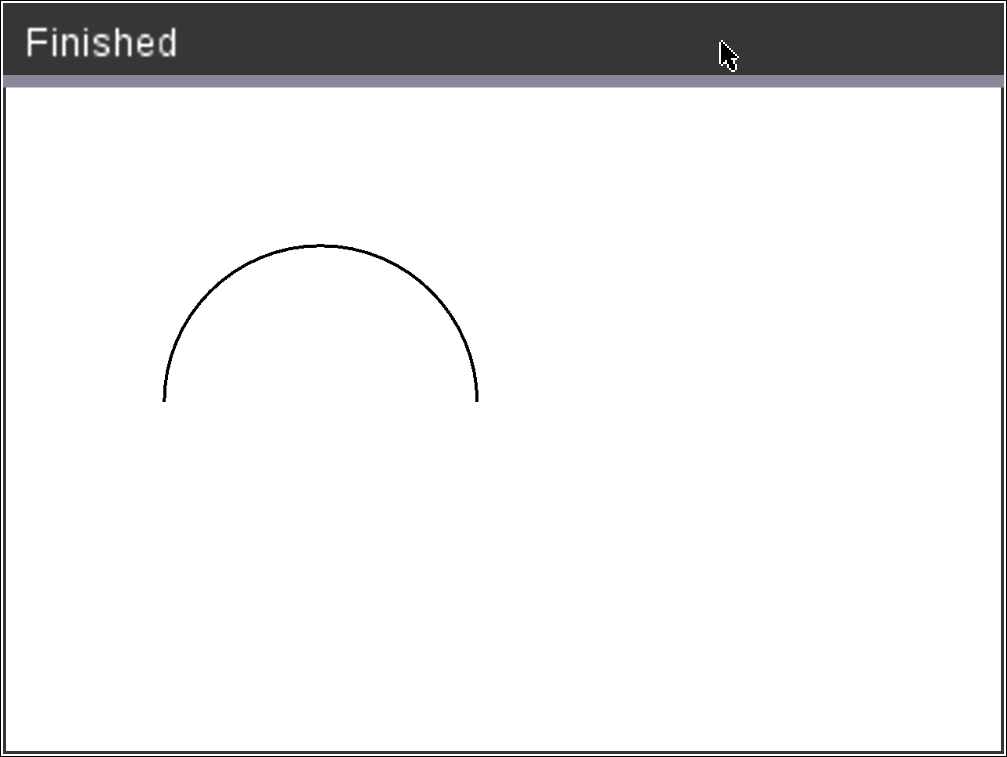
DrawArc x, y, width, height, startAngle, arcAngle Draw an arc within the defined bounding rectangle with the provided start and arc angles. x, y: upper left coordinate of bounding rectangle width, height: dimensions of bounding rectangle The "arc angle" defines the sweep of the arc. These parameters can be provided as expressions that evaluate to a number which is then rounded to the nearest integer. |
DrawArc 20,20,100,100,0,90
DrawArc 50,50,100,100,0,180
|
|
See Also: FillArc |
|
|
|
Catalog > |
|
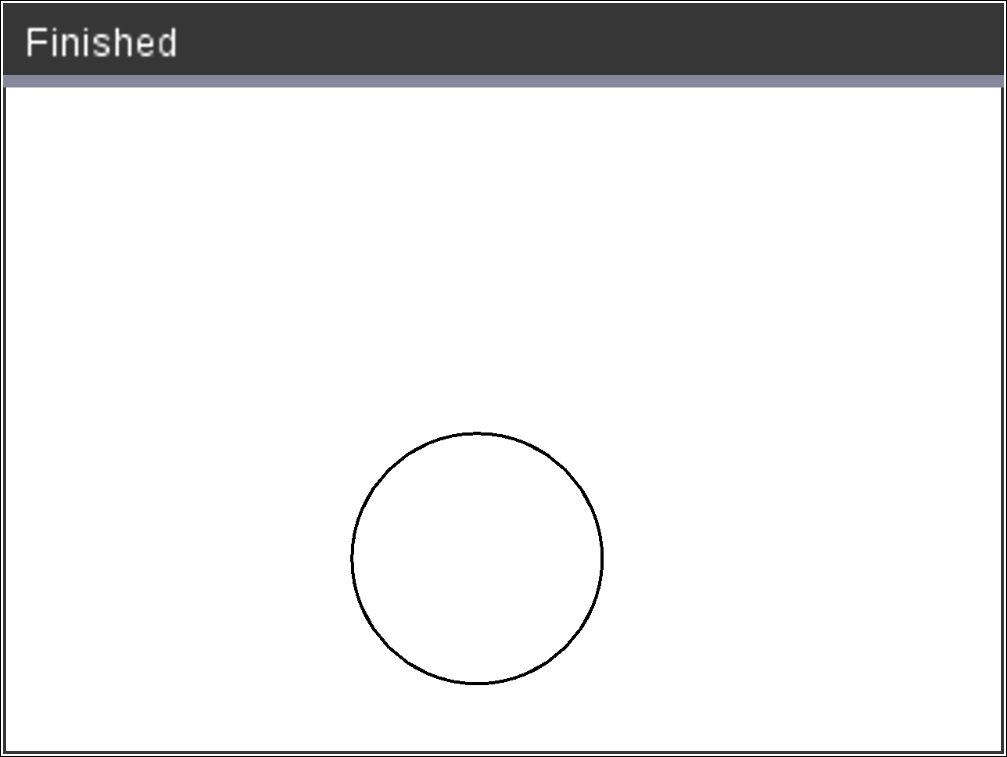
DrawCircle x, y, radius x, y: coordinate of center radius: radius of the circle |
DrawCircle 150,150,40
|
|
See Also: FillCircle |
|
|
|
Catalog > |
|
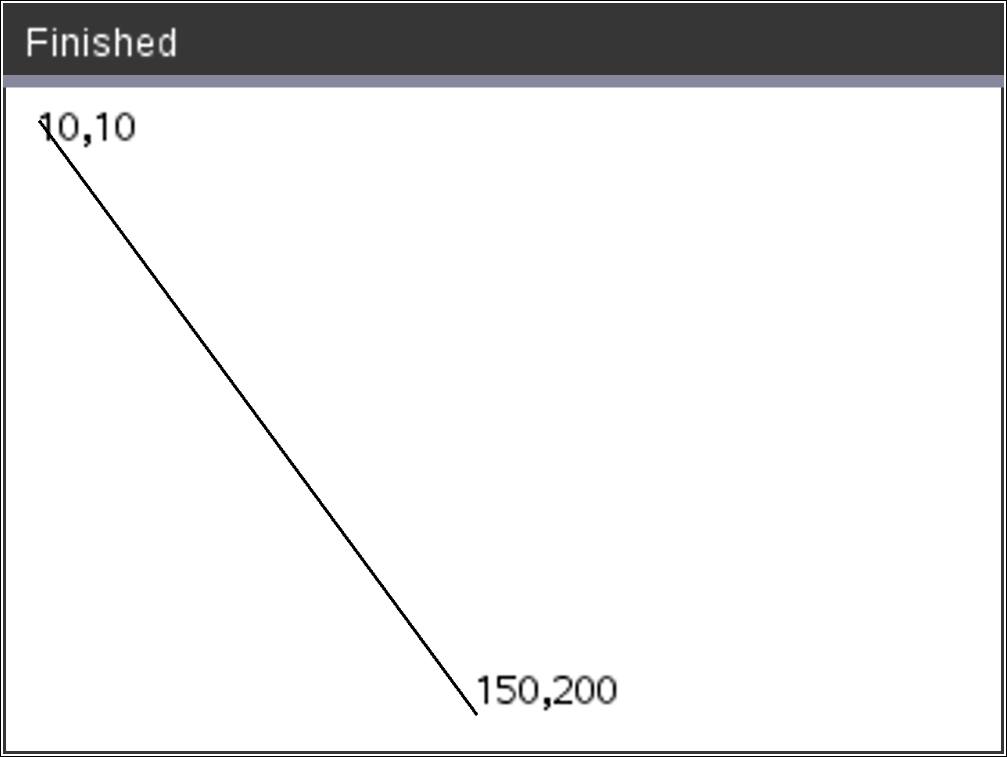
DrawLine x1, y1, x2, y2 Draw a line from x1, y1, x2, y2. Expressions that evaluate to a number which is then rounded to the nearest integer. Screen bounds: If the specified coordinates causes any part of the line to be drawn outside of the graphics screen, that part of the line will be clipped and no error message will be displayed. |
DrawLine 10,10,150,200
|
|
|
Catalog > |
|
The commands have two variants: DrawPoly xlist, ylist or DrawPoly x1, y1, x2, y2, x3, y3...xn, yn Note: DrawPoly xlist, ylist Note: DrawPoly x1, y1, x2, y2, x3, y3...xn, yn Expressions that evaluate to a list of real floats Expressions that evaluate to a single real float Note: DrawPoly: Input size dimensions (width/height) relative to drawn lines. |
xlist:={0,200,150,0} ylist:={10,20,150,10} DrawPoly xlist,ylist
DrawPoly 0,10,200,20,150,150,0,10
|
|
See Also: FillPoly |
|
|
|
Catalog > |
|
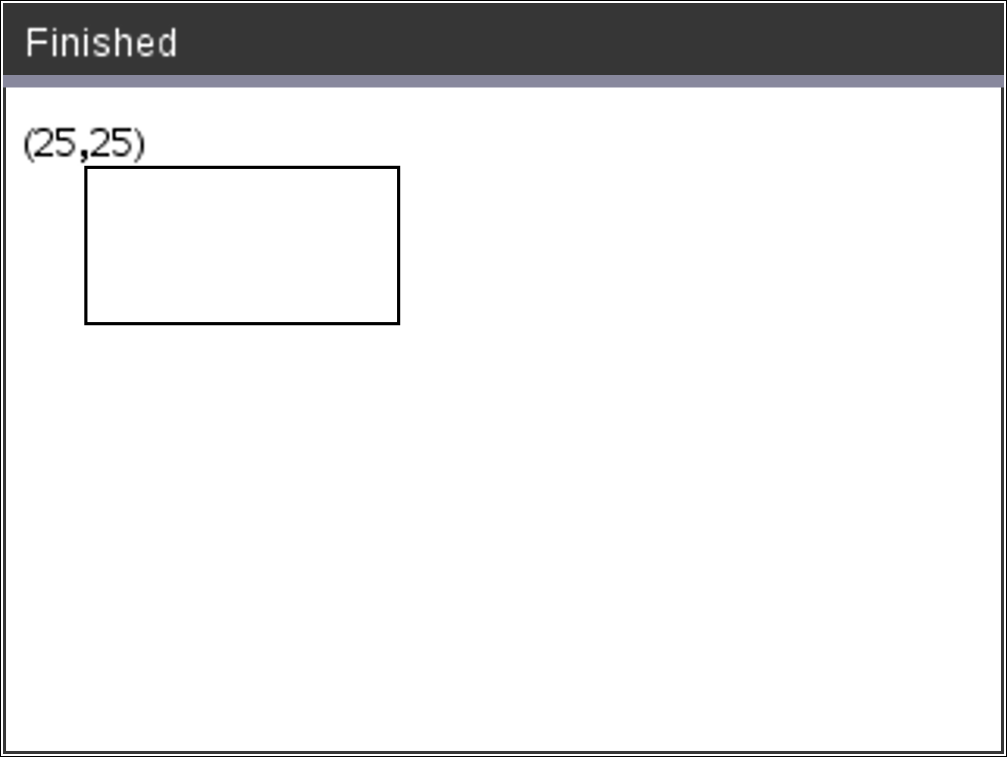
DrawRect x, y, width, height x, y: upper left coordinate of rectangle width, height: width and height of rectangle (rectangle drawn down and right from starting coordinate). Note: The lines are drawn in a bounding box around the specified coordinate and dimensions such that the actual size of the drawn rectangle will be larger than the width and height indicate. |
DrawRect 25,25,100,50
|
|
See Also: FillRect |
|
|
|
Catalog > |
|
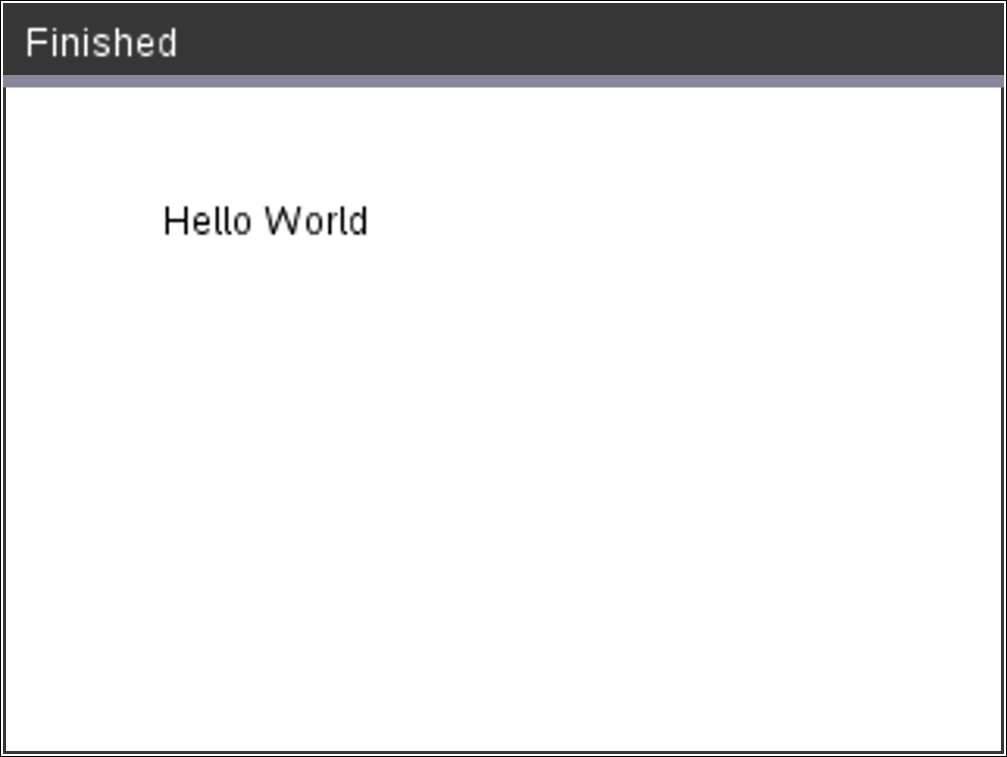
DrawText x, y, exprOrString1 [,exprOrString2]... x, y: coordinate of text output Draws the text in exprOrString at the specified x, y coordinate location. The rules for exprOrString are the same as for Disp – DrawText can take multiple arguments. |
DrawText 50,50,"Hello World"
|
F
|
|
Catalog > |
|---|---|
|
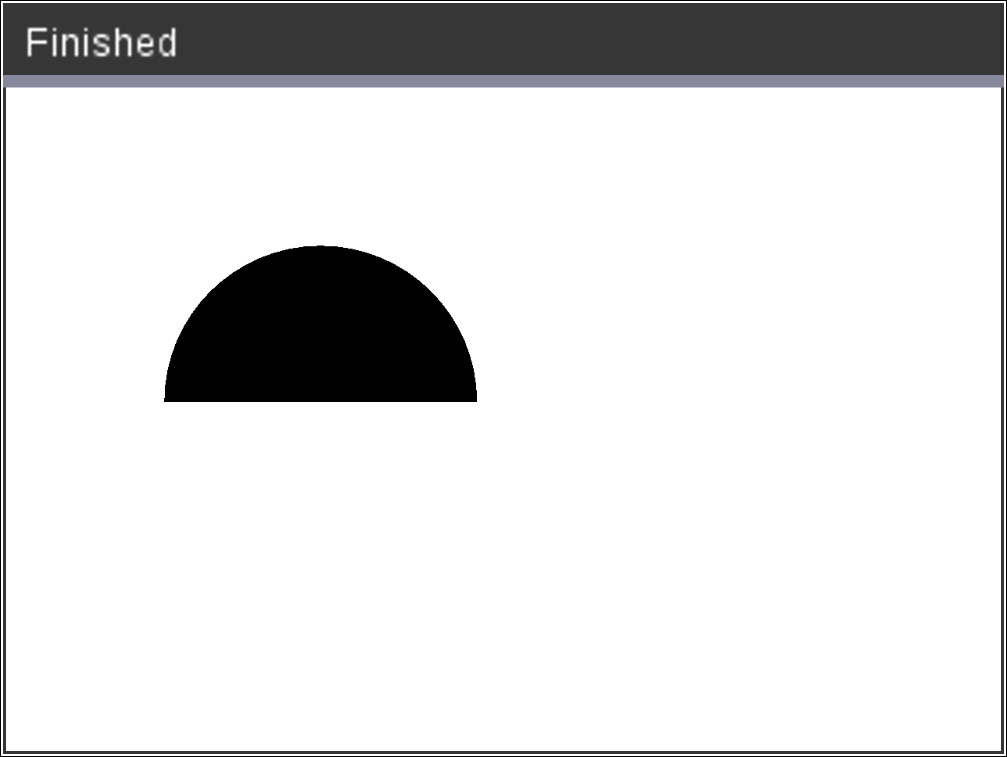
FillArc x, y, width, height startAngle, arcAngle x, y: upper left coordinate of bounding rectangle Draw and fill an arc within the defined bounding rectangle with the provided start and arc angles. Default fill color is black. The fill color can be set by the SetColor command The "arc angle" defines the sweep of the arc |
FillArc 50,50,100,100,0,180
|
|
|
Catalog > |
|---|---|
|
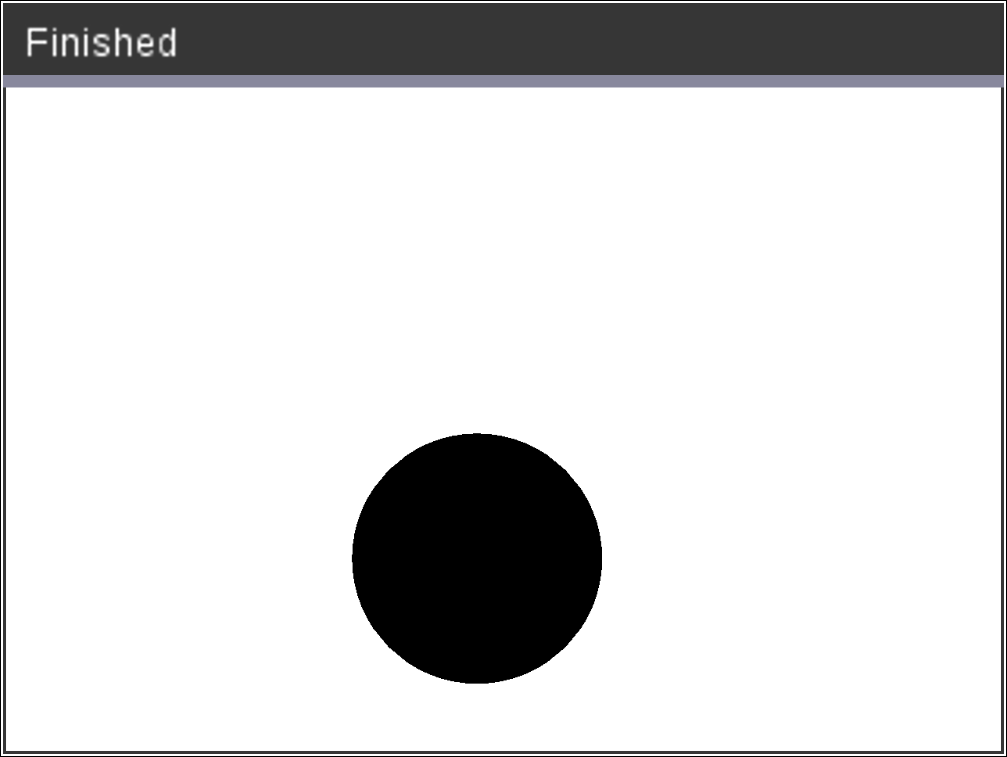
FillCircle x, y, radius x, y: coordinate of center Draw and fill a circle at the specified center with the specified radius. Default fill color is black. The fill color can be set by the SetColor command. |
FillCircle 150,150,40
Here! |
|
|
Catalog > |
|---|---|
|
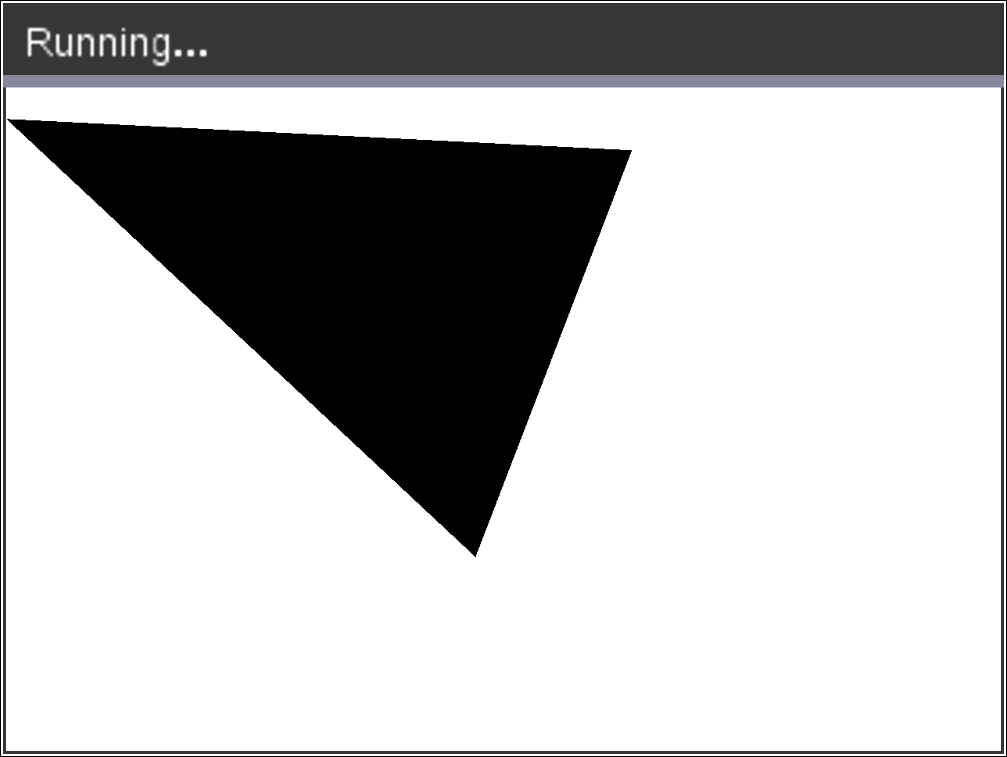
FillPoly xlist, ylist or FillPoly x1, y1, x2, y2, x3, y3...xn, yn Note: The line and color are specified by SetColor and SetPen |
xlist:={0,200,150,0} ylist:={10,20,150,10} FillPoly xlist,ylist
FillPoly 0,10,200,20,150,150,0,10
|

|
|
Catalog > |
|---|---|
|
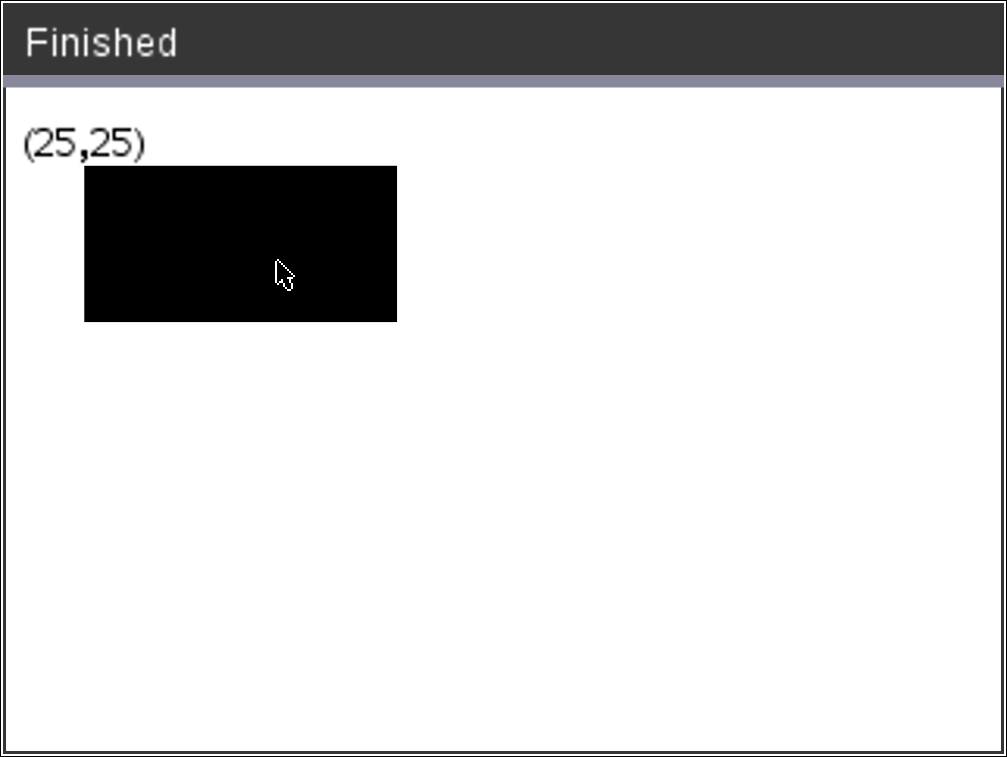
FillRect x, y, width, height x, y: upper left coordinate of rectangle width, height: width and height of rectangle Draw and fill a rectangle with the top left corner at the coordinate specified by (x,y) Default fill color is black. The fill color can be set by the SetColor command Note: The line and color are specified by SetColor and SetPen |
FillRect 25,25,100,50
|
G
|
|
Catalog > |
|---|---|
|
getPlatform() Returns: |
|

P
|
|
Catalog > |
|---|---|
|
PaintBuffer Paint graphics buffer to screen This command is used in conjunction with UseBuffer to increase the speed of display on the screen when the program generates multiple graphical objects. |
UseBuffer For n,1,10 x:=randInt(0,300) y:=randInt(0,200) radius:=randInt(10,50) Wait 0.5 DrawCircle x,y,radius EndFor PaintBuffer This program will display all the 10 circles at once. If the “UseBuffer” command is removed, each circle will be displayed as it is drawn.
|
|
See Also: UseBuffer |
|
|
|
Catalog > |
|---|---|
|
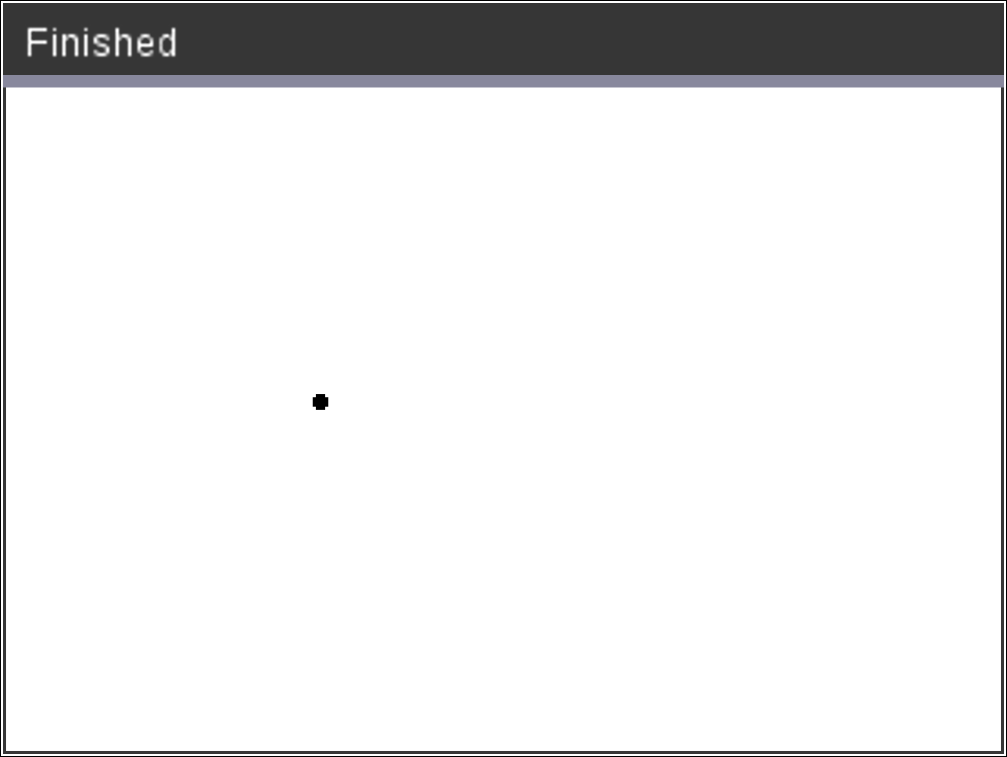
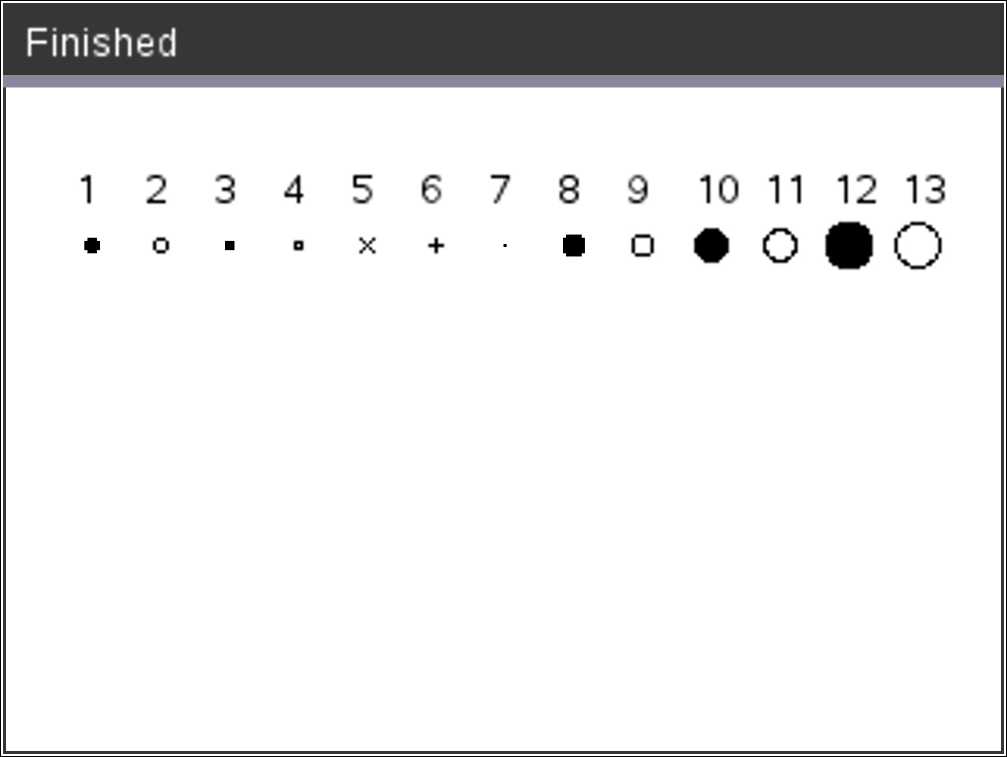
PlotXY x, y, shape x, y: coordinate to plot shape shape : a number between 1 and 13 specifying the shape 1 - Filled circle 2 - Empty circle 3 - Filled square 4 - Empty square 5 - Cross 6 - Plus 7 - Thin 8 - medium point, solid 9 - medium point, empty 10 - larger point, solid 11 - larger point, empty 12 - largest point, solid 13 - largest point, empty
|
PlotXY 100,100,1
For n,1,13 DrawText 1+22*n,40,n PlotXY 5+22*n,50,n EndFor
|
S
|
|
Catalog > |
|---|---|
|
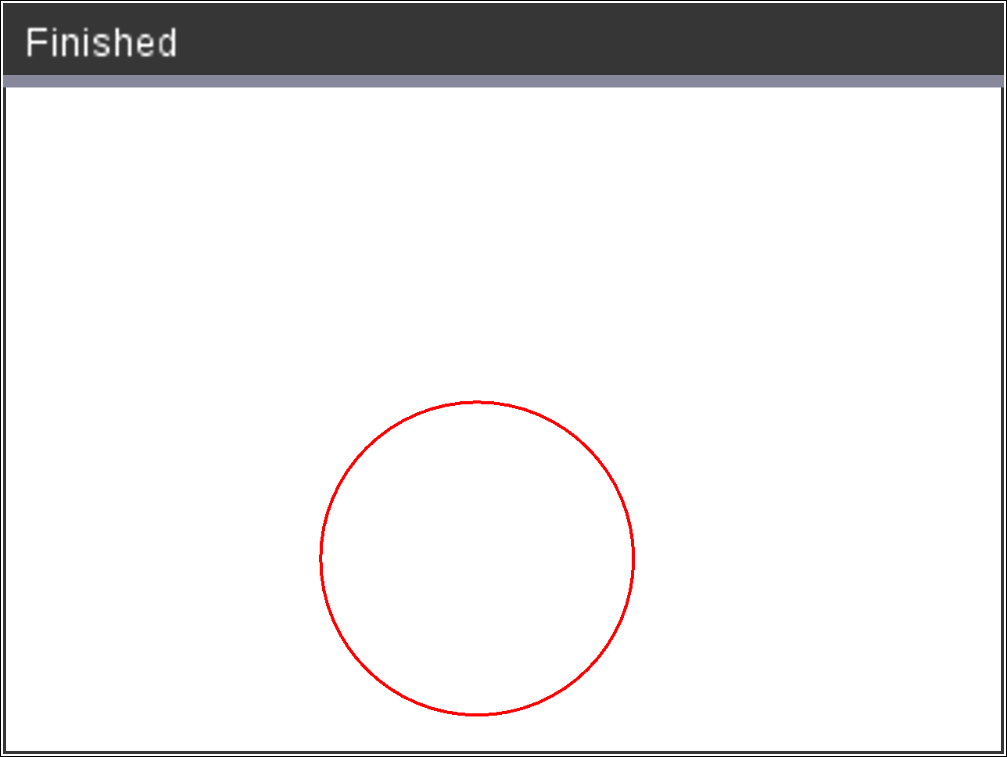
SetColor Red-value, Green-value, Blue-value Valid values for red, green and blue are between 0 and 255 Sets the color for subsequent Draw commands |
SetColor 255,0,0 DrawCircle 150,150,100
|
|
|
Catalog > |
|---|---|
|
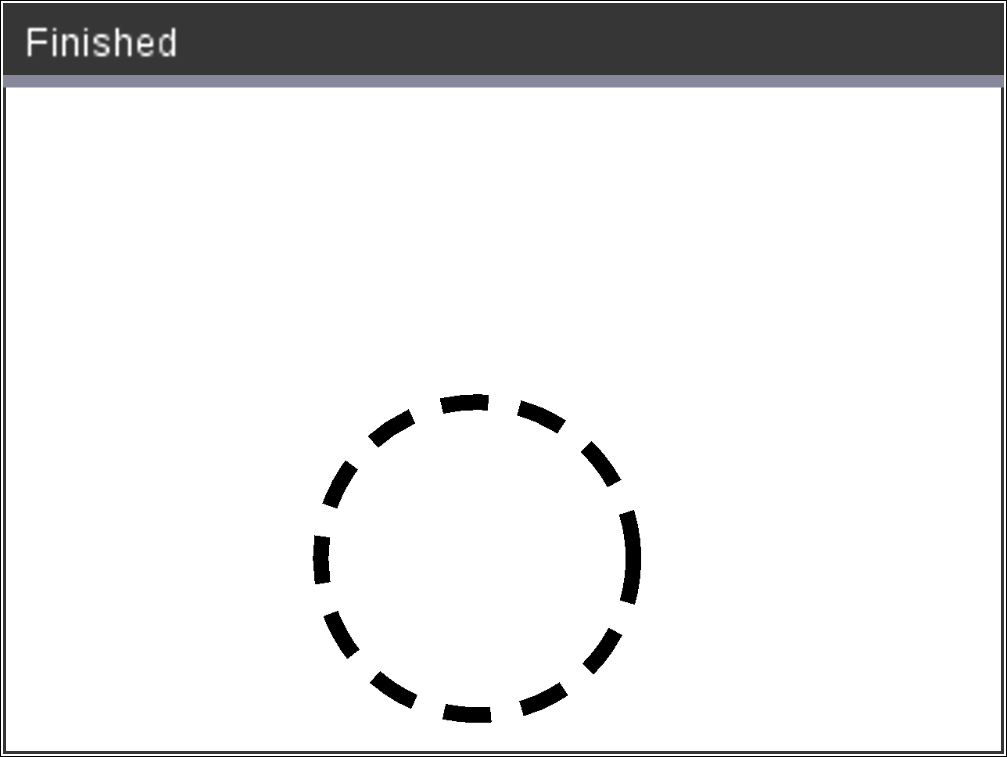
SetPen thickness, style thickness: 1 <= thickness <= 3|1 is thinnest, 3 is thickest style: 1 = Smooth, 2 = Dotted, 3 = Dashed Sets the pen style for subsequent Draw commands |
SetPen 3,3 DrawCircle 150,150,50
|
|
|
Catalog > |
|---|---|
|
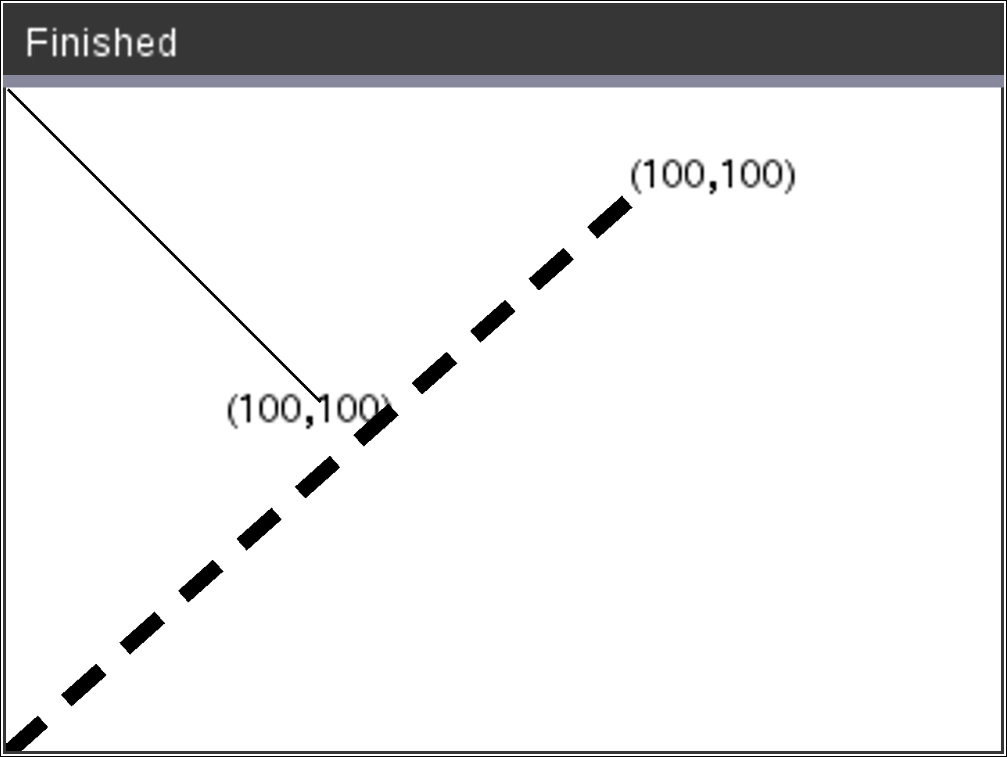
SetWindow xMin, xMax, yMin, yMax Establishes a logical window that maps to the graphics drawing area. All parameters are required. If the part of drawn object is outside the window, the output will be clipped (not shown) and no error message is displayed. If xmin is greater than or equal to xmax or ymin is greater than or equal to ymax, an error message is shown. Any objects drawn before a SetWindow command will not be re-drawn in the new configuration. To reset the window parameters to the default, use: SetWindow 0,0,0,0 |
SetWindow 0,160,0,120 will set the output window to have 0,0 in the bottom left corner with a width of 160 and a height of 120 DrawLine 0,0,100,100 SetWindow 0,160,0,120 SetPen 3,3 DrawLine 0,0,100,100
|
U
|
|
Catalog > |
|---|---|
|
UseBuffer Draw to an off screen graphics buffer instead of screen (to increase performance) This command is used in conjunction with PaintBuffer to increase the speed of display on the screen when the program generates multiple graphical objects. With UseBuffer, all the graphics are displayed only after the next PaintBuffer command is executed. UseBuffer only needs to be called once in the program i.e. every use of PaintBuffer does not need a corresponding UseBuffer
|
UseBuffer For n,1,10 x:=randInt(0,300) y:=randInt(0,200) radius:=randInt(10,50) Wait 0.5 DrawCircle x,y,radius EndFor PaintBuffer This program will display all the 10 circles at once. If the “UseBuffer” command is removed, each circle will be displayed as it is drawn. |
|
See Also: PaintBuffer |
|