Menus
Functions
Main Menu
File
Save the data from an experiment or select New and Vernier EasyData™ App restarts in the default data-collection mode, and the default settings are restored.
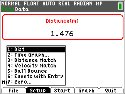
Setup
Set up the experiment.
The menu will differ depending on the sensor. For example, for connected CBR 2™ motion detector, the setup menu displays as follows:
Time Graph
Open the Time Graph Settings wizard.
Sample Interval
Set the interval in seconds. Select Next to go to the next setting.
Number of Samples
Set the total number of samples to collect.
Experiment Length
Set the length of the experiment in seconds.
Edit
Edit the time graph settings.
Cancl
Cancel your changes and return to the previous settings.
OK
Return to the main menu.
Events with Entry
Capture samples manually for a set of events that you define. Each sampled value becomes a y-value; you enter the x-value.
Keep
Capture the current sampled (y) value.
Enter value
Assign an x-value to define the data point. Then select OK.
Stop
Select Stop to end the experiment. The data points are displayed as a graph (a calculator scatter plot).
Main
Return to the main menu.
Zero
Use the current data reading as a zero reference.
Start
Start collecting data.
Stop
Stop collecting data. A scaled graph of the collected data appears.
Main
Return to the main menu.
Graph
Graph the resulting equation.
Adv
Select independent and dependent lists to plot various views of the data.
Plots
Plot options such as distance vs. time, velocity vs. time, and acceleration vs. time (dependent on sensor connected).
Anlyz
Computes statistics on data collected and finds a variety of regression fit to data (dependent on sensor connected).
Scale
Options to auto-fit or manually edit the graph scaling.
Quit
Quit the application. The collected data has been transferred to the calculator’s lists.