Menus/Menu Items
Description
Conic Settings(Press z)
Type
Select the calculator mode.
FUNC: Function plots functions where Y is a function of X.
PAR: Parametric plots relations where X and Y are functions of T.
POL: Polar plots functions where R is a function of
Window Settings
Select AUTO so that the windows change automatically.
Select MAN so that you can manually change window settings.
Esc
Return to the previous screen.
Main Menu
A circle is the set of points in a plane whose distance from a given fixed point in the plane is constant. The fixed point is the center of the circle; the constant distance is the radius.
An ellipse is the set of points whose distances from two fixed points in the plane have a constant sum. The two fixed points are the foci of the ellipse. The line through the foci of an ellipse is the ellipse's focal axis. The point on the axis halfway between the foci is the center. The points where the focal axis and ellipse intersect are the ellipse's vertices.
A hyperbola is the set of points in a plane whose distances from two fixed points in the plane have a constant difference. The two fixed points are the foci of the hyperbola. The line through the foci of the hyperbola is the focal axis. The point on the axis halfway between the foci is the hyperbola's center. The points where the focal axis and hyperbola cross are the vertices.
A set that consists of all the points in a plane equidistant from a given fixed point and a given fixed line in the plane is a parabola. The fixed point is the focus of the parabola. The fixed line is the directrix. The point where the focal axis intersects the parabola is the vertex.
Info
Display the information screen, which contains the application version number.
Quit
Select QUIT to exit Conic Graphing.
Esc
Select ESC to go back one screen.
Circle Menu
(X-H)2 + (Y-K)2 = R2
In FUNC mode, select this equation and input H, K and R.
AX2 + AY2 + BX + CY+ D = 0
In FUNC mode, select this equation and input A, B, C and D.
X=Rcos(T)+H
Y=Rsin(T)+K
In PAR mode, select this parametric equation and input H, K and R.
1: R+2Acos(0)
In POL mode, select this polar equation and input A.
2: R=2Asin(0)
In POL mode, select this polar equation and input A.
3: A2=B2+R2-2BRcos(0-b)
Select this polar equation and input A, B and b.
[GRAPH]
Select to graph the equation.
ƒ \
Display the center and radius.
r
Trace the circle.
Ellipse Menu
1: 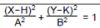
In FUNC mode, select this equation and input A, B, H and K.
2: 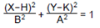
In FUNC mode, select this equation and input A, B, H and K.
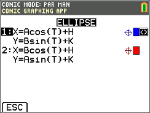
In PAR mode, select this parametric equation and input A, B, H and K.
In PAR mode, select this parametric equation and input A, B, H and K.
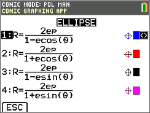
In POL mode, select this polar equation and input e and p.
In POL mode, select this polar equation and input e and p.
In POL mode, select this polar equation and input e and p.
In POL mode, select this polar equation and input e and p.
[GRAPH]
Select to graph the equation.
ƒ \
Display the center and foci.
r ¤
Trace the orbit.
Hyperbola Menu
1: 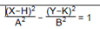
In FUNC mode, select this function equation and input A, B, H and K.
2: 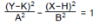
In FUNC mode, select this function equation and input A, B, H and K.
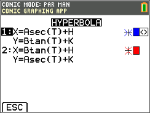
In PAR mode, select this parametric equation and input A, B, H and K.
In PAR mode, select this parametric equation and input A, B, H and K.
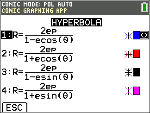
In POL mode, select this polar equation and input e and p.
In POL mode, select this polar equation and input e and p.
In POL mode, select this polar equation and input e and p.
In POL mode, select this polar equation and input e and p.
[GRAPH]
Select to graph the equation.
ƒ \
Display the center, vertices, foci, and slope of the asymptotes.
r ¤
Trace the hyperbola.
Parabola Menu
1: (Y-K)2 = 4P(X-H)
In FUNC mode, select this function equation and input A, B, H and K.
2: (X-H)2 = 4P(Y-K)
In FUNC mode, select this function equation and input A, B, H and K.
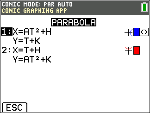
In PAR mode, select this parametric equation and input A, H and K.
In PAR mode, select this parametric equation and input A, H and K.
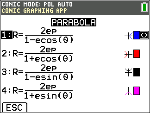
In POL mode, select this polar equation and input e and p.
In POL mode, select this polar equation and input e and p.
In POL mode, select this polar equation and input e and p.
In POL mode, select this polar equation and input e and p.
[GRAPH]
Select to graph the equation.
ƒ \
Display the vertex, focus, and directrix.
r ¤
Trace the trajectory.