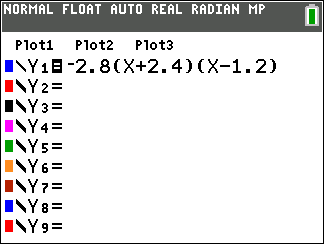
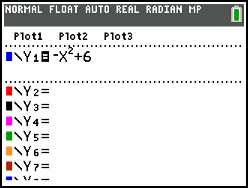
Enter an equation in the Y= editor.
| 1. | Press o. |
| 2. | Press k „ ¡ Ã 6. |
To set the line color in the Y= editor:
| 1. | Press | to highlight the color and line style indicator. |
| 2. | Press [enter]. |
The spinner dialog displays. Notice the second line in the status bar, which displays hints.
| 3. | Press ~ ~ ~ to place the cursor box on the color and line style at the left of the screen and press [enter]. |
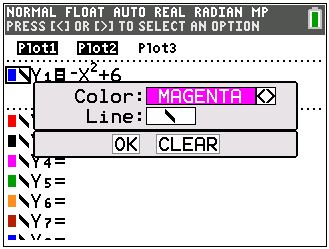
| 4. | Press ~ ~ ~ to select MAGENTA. |
| 5. | Press †. |
Note: The thick line style is the default. It can be changed by pressing | or ~.
| 6. | Press † to highlight OK and then press [enter]. |
To set a Background Image:
| 1. | Press y .. |
Set GridColor, Axes, and BorderColor as desired.
| 2. | Press } or † as necessary to highlight Background. |
The spinner menu becomes active.
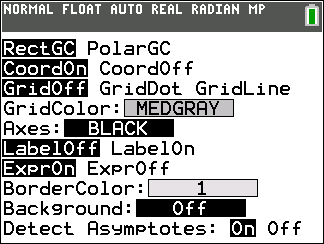
| 3. | Press | or ~ to select the desired Background Image or color. |
Note: There are five Image Vars included in your TI-84 Plus CE online calculator.
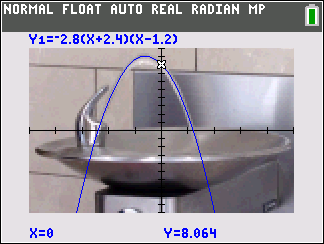
| 4. | Press r to see the graph and trace points. |
Note: You can manipulate the graph to “fit” an object in the Background Image Var. You can also use QuickPlot and Fit Equation to fit an equation to a shape. (See QuickPlot.)