Drop points on the screen. Points can be saved to lists.
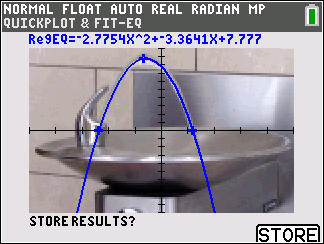
Calculate the regression equation, draw the curve, and store the function.
QuickPlot and Fit Equation allows you to drop points on a graph screen and model a curve to those points using regression functions. You can select color and line style, draw points on a graph, and choose an equation to fit the drawn points. You can then store the results of the plot and equation.
QuickPlot and Fit Equation is an option in the … CALC menu.
|
Drop points on the screen. Points can be saved to lists. |
|
Calculate the regression equation, draw the curve, and store the function. |