| 1. | Press Œ. |
| 2. | Choose Transfrm. |
| 3. | Read the message on the splash screen. |
| 4. | Press any key to dismiss the splash screen. |
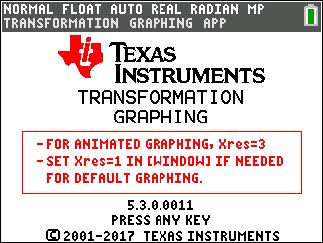
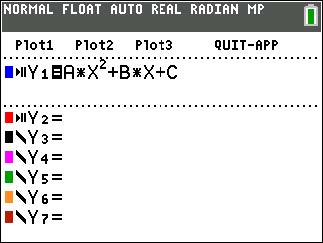
| 5. | In Func mode, press o to display the Y= editor. |
| 6. | Press ‘ to clear Y1. |
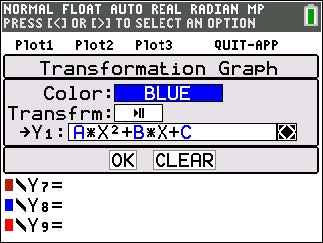
| 7. | To quickly paste the function Y1=AX2+BX+C, press | | [enter] to launch the line style spinner. |
| 8. | Press † † and then ~ to the desired function. |
| 9. | Select OK and press [enter]. |
Note: The color/line style spinner dialog also lets you select the animation of the transform graph. Play-Pause 3 will allow you to control the animation of the graph using the arrow keys on the graph screen.
Tip: If you enter a function using the keypad, only A-D are allowed in transform equations Y1 and/or Y2. Those letters can be found using the ƒ key. For example, to enter the coefficient A, press ƒ [A] (above the » key).
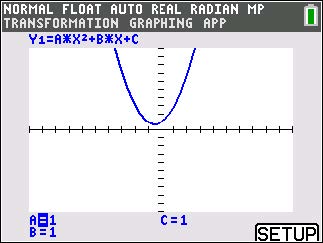
| 10. | Press q 6 to select 6:ZStandard. The graph screen displays automatically. The selected Y= function and the current values of the coefficients A, B, and, C display on the screen. The values of A, B, and C may be different on your calculator. |
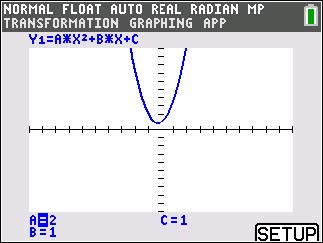
| 11. | Press ~ to increment the value of A by the Step value (1) from 1 to 2. The graph is redrawn automatically, showing the effect of increasing the coefficient of X by step size 1 as set in the SETTINGS ([SETUP]) menu. |
If the coefficient A is not selected, press † until the = sign for A is highlighted.
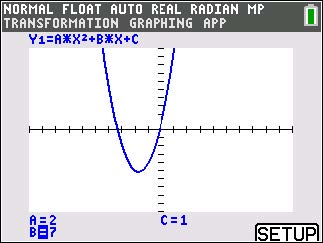
| 12. | Press † to highlight the = sign for B. Press ~ several times (pausing briefly each time as the graph is redrawn) to observe the effect of increasing the value of B. |
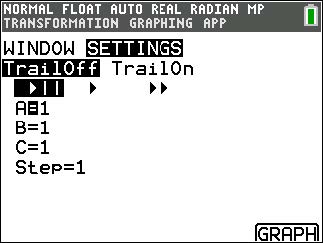
Tip: Press [SETUP] (b) on the graph screen to display the SETTINGS menu.
Select TrailOn to leave a dotted graph each time you change or animate a coefficient. Default is TrailOff. TrailOff and TrailOn are also available in y ..
The play 1 and play fast 2 settings allow you to create animated slide show of the graph transforming by one selected parameter. The parameter values for A-D can be entered in SETTINGS as long as they are used in Y1 and/or Y2.
The Step value determines the increment of the parameter value. The Max value is the upper bound of the parameter expected in the animation.
Example: Y1=AX
In SETTINGS, let A=1, Step = 2, and Max = 10. Five screens will be created to animate the graph for A = 1, 3, 5, 7, 9. Note 9 < 10 = Max.
There can be up to 13 screens created for the animation. A memory error will be given if the Step and Max request more than 13 screens for the animation. To continue, press p and press } to SETTINGS. Modify the Step or Max value to remain within the 13 screen limit.