|
c)
|
Press any key to dismiss the splash screen.
The cursor will blink over the = sign in the enhanced inequality Y=editor. |
Note: The context help line of the status bar gives help such as :
SELECT RELATION: | [enter]. (See screen.)
|

|
|
2.
|
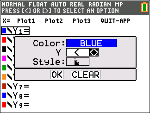
Press | [enter] to open the graph style dialog to select the relation. |
|
3.
|
Press † to move the cursor to Y. |
|
4.
|
Press | or ~ to change selections to "less than." |
|
5.
|
Press † to highlight OK. |
|
6.
|
Press [enter].
Note: The TI-84 Plus CE version of Inequality Graphing uses the same graph style setting dialog box as the operating system. The context help line of the status bar indicates PRESS [<] OR [>] TO SELECT AN OPTION.
The TI-84 Plus C version relation selection uses shortcuts F1-F5 to change the relation type. |
|
|
|
7.
|
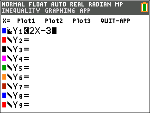
Press ~ to move the cursor and enter
Y1 <2x-3. |
|
|
|
8.
|
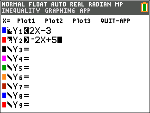
Repeat the steps above to change the relation of Y2 to "greater than" and enter
Y2 > -2X+5. |
|
|
|
9.
|
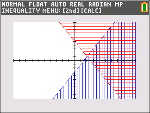
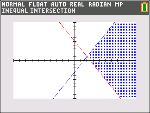
Press s to view the shaded inequalities.
Note: The context help line of the status bar displays INEQUALITY MENU: y /. This menu contains the tools for an inequality intersection and other features. The TI-84 Plus C version displays these tools as shortcut [F1]-[F5] on the graph screen. |
|
|
|
10.
|
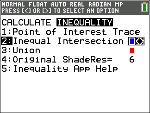
To find the intersection of the two inequalities: |
|
b)
|
Press ~ to select the INEQUALITY menu. |
|
c)
|
Select 2:Inequal Intersection. |
Notes:
|
•
|
You can change the color of the intersection by pressing [<] or [>] when the color spinner on the right of the screen is blinking. |
|
•
|
Use the features on the INEQUALITY menu to find Point of Interest Trace, which gives the intersection point(s) of the boundaries of the regions shaded. |
|
•
|
Use the Union feature on the INEQUALITY menu to display the union of the regions. Use Original Shade to display the original shading of the regions. |
Note: The Inequality menu features are accessed with shortcut keys [F1]-[F5] on the graph screen in the TI-84 Plus C version.
|
|
|
11.
|
To examine the intersection of the boundaries of the two regions: |
|
b)
|
Press ~ to select the INEQUALITY menu. |
|
c)
|
Select 1: Point of Interest Trace. |
Notes:
|
•
|
Since both Y1 and Y2 are strict inequalities, the notation used in the expression area is Y1, Y2, which is called a point of interest. If point of interest is an intersection of a boundary included in the region, the notation will display the intersection symbol. |
|
•
|
If more than one point of interest is in the graph area, use the arrow keys to trace point to point. Not all points of interest may be located if boundaries are non-linear.
|
|

|