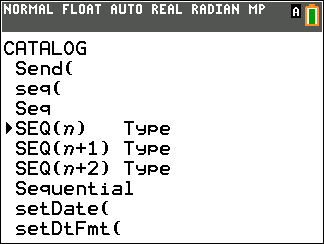
Note: "Type" will NOT be included in the TIC CE PE syntax
On the device, "Type" does not paste and is similar to how the device displays, for example, DEC Answers where Answers appears in [catalog] but does not paste.
.
|
|
|
|---|---|
|
2‑SampÜTest[listname1,listname2,freqlist1,freqlist2,alternative,drawflag,color#] Performs a two-sample Û test. alternative=L1 is <; alternative=0 is ; alternative=1 is >. drawflag=1 draws results; drawflag=0 calculates results. Color#: 10 - 24 or color name pasted from [vars] COLOR. |
† … |
|
2‑SampÜTest |
|
|---|---|
|
2‑SampÜTestSx1,n1,Sx2,n2[,alternative,drawflag,color#] Performs a two-sample Û test. alternative=L1 is <; alternative=0 is ; alternative=1 is >. drawflag=1 draws results; drawflag=0 calculates results. Color#: 10 - 24 or color name pasted from [vars] COLOR. |
† … |
|
|
|
|---|---|
|
2‑SampTInt[listname1,listname2,freqlist1,freqlist2,confidence level,pooled] Computes a two-sample t confidence interval. pooled=1 pools variances; pooled=0 does not pool variances. |
† … |
|
2‑SampTInt |
|
|---|---|
|
2‑SampTIntv1,Sx1,n1,v2,Sx2,n2[,confidence level,pooled] Computes a two-sample t confidence interval. pooled=1 pools variances; pooled=0 does not pool variances. |
† … |
|
|
|
|---|---|
|
2‑SampTTest [listname1,listname2,freqlist1,freqlist2,alternative,pooled,drawflag,color#]) Computes a two-sample t test. alternative=L1 is <; alternative=0 is ; alternative=1 is >. pooled=1 pools variances; pooled=0 does not pool variances. drawflag=1 draws results; drawflag=0 calculates results. Color#: 10 - 24 or color name pasted from [vars] COLOR. |
† … |
|
|
|
|---|---|
|
2‑SampTTestv1,Sx1,n1,v2,Sx2,n2[,alternative,pooled,drawflag,color#]) Computes a two-sample t test. alternative=L1 is <; alternative=0 is ; alternative=1 is >. pooled=1 pools variances; pooled=0 does not pool variances. drawflag=1 draws results; drawflag=0 calculates results. Color#: 10 - 24 or color name pasted from [vars] COLOR. |
† … |
|
|
|
|---|---|
|
2‑SampZInt(s1,s2[,listname1,listname2,freqlist1,freqlist2,confidence level]) Computes a two-sample z confidence interval. |
† … |
|
2‑SampZInt( |
|
|---|---|
|
2‑SampZInt(s1,s2,v1,n1,v2,n2[,confidence level]) Computes a two-sample z confidence interval. |
† … |
|
|
|
|---|---|
|
2‑SampZTest( s1,s2[,listname1,listname2,freqlist1,freqlist2,alternative,drawflag,color#]) Computes a two-sample z test. alternative=L1 is <; alternative=0 is ; alternative=1 is >. drawflag=1 draws results; drawflag=0 calculates results. Color#: 10 - 24 or color name pasted from [vars] COLOR. |
† … |
|
2‑SampZTest( |
|
|---|---|
|
2‑SampZTest(s1,s2,v1,n1,v2,n2[,alternative,drawflag,color#]) Computes a two-sample z test. alternative=L1 is <; alternative=0 is ; alternative=1 is >. drawflag=1 draws results; drawflag=0 calculates results. Color#: 10 - 24 or color name pasted from [vars] COLOR. |
† … |
|
Scatter |
|
|---|---|
|
Scatter Plot#(type,Xlist,[,freqlist,color#]) Used as the "type" argument in the command Where # gives Plot1, Plot2 or Plot3. |
† y , |
|
|
|
|---|---|
|
Sci Sets scientific notation display mode. |
† z |
|
|
|
|---|---|
|
Select(Xlistname,Ylistname) Selects one or more specific data points from a scatter plot or xyLine plot (only), and then store's the selected data points to two new lists, Xlistname and Ylistname. |
y 9 |
|
|
|
|---|---|
|
Send(string) Sends one or more TI-Innovator™ Hub commands to a connected hub. Notes: See also eval( and Get( command related to the Send( command. TI-Innovator™ Hub commands are supported in the HUB submenu in the CE OS v.5.2 program editor. |
† ¼ |
|
TI-Innovator™ Hub |
|
|---|---|
|
Send(string) Sends one or more TI-Innovator™ Hub commands to a connected hub. Notes: See also eval( and Get( command related to the Send( command. TI-Innovator™ Hub commands are supported in the HUB submenu in the CE OS v.5.2 program editor. |
† ¼ See menu location depending on TI-Innovator Hub sensors. |
|
|
|
|---|---|
|
seq(expression,variable,begin,end[,increment]) Returns list created by evaluating expression with regard to variable, from begin to end by increment. |
y 9 |
|
|
|
|---|---|
|
Seq(n) In sequence mode, SEQ(n) sets the sequence editor type to enter sequence functions, u, v, or w, as a function of the independent variable n. Can also be set from the Y= editor in SEQ mode. |
† z |
|
SEQ(n+1) |
|
|---|---|
|
Seq(n+1) In sequence mode, SEQ(n+1) sets the sequence editor type to enter sequence functions, u, v, or w, as a function of the independent variable n+1. Can also be set from the Y= editor in SEQ mode. |
† z |
|
SEQ(n+2) |
|
|---|---|
|
Seq(n+2) In sequence mode, SEQ(n+2) sets the sequence editor type to enter sequence functions, u, v, or w, as a function of the independent variable n+2. Can also be set from the Y= editor in SEQ mode. |
† z |
|
|
Note: "Type" will NOT be included in the TIC CE PE syntax On the device, "Type" does not paste and is similar to how the device displays, for example, DEC Answers where Answers appears in [catalog] but does not paste. . |
|
|
|
|---|---|
|
Seq Sets sequence graphing mode. |
† z |
|
|
|
|---|---|
|
Sequential Sets mode to graph functions sequentially. |
† z |
|
|
|
|---|---|
|
setDate(year,month,day) Sets the date using a year, month, day format. The year must be 4 digits; month and day can be 1 or 2 digit. |
y N |
|
|
|
|---|---|
|
setDtFmt(integer) Sets the date format. 1 = M/D/Y |
y N |
|
|
|
|---|---|
|
setTime(hour,minute, second) Sets the time using an hour, minute, second format. The hour must be in 24 hour format, in which 13 = 1 p.m. |
y N setTime( |
|
|
|
|---|---|
|
setTmFmt(integer) Sets the time format. 12 = 12 hour format |
y N setTmFmt( |
|
|
|
|---|---|
|
SetUpEditor Removes all list names from the stat list editor, and then restores list names L1 through L6 to columns 1 through 6. |
… |
|
SetUpEditor |
|
|---|---|
|
SetUpEditor listname1[,listname2,...,listname20] Removes all list names from the stat list editor, then sets it up to display one or more listnames in the specified order, starting with column 1. |
… |
|
|
|
|---|---|
|
ShadeÜ(lowerbound,upperbound,numerator df,denominator df[,color#]) Draws the density function for the Û distribution specified by numerator df and denominator df and shades and colors the area between lowerbound and upperbound. Color#: 10 - 24 or color name pasted from [vars] COLOR. |
y = |
|
|
|
|---|---|
|
Shade_t(lowerbound,upperbound,df[,color#]) Draws the density function for the Student‑t distribution specified by degrees of freedom df, and shades or colors the area between lowerbound and upperbound. Color#: 10 - 24 or color name pasted from [vars] COLOR. |
y = |
|
|
|
|---|---|
|
Simul Sets mode to graph functions simultaneously. |
† z |
|
|
|
|---|---|
|
sin(value) Returns the sine of a real number, expression, or list. |
˜ |
|
|
|
|---|---|
|
sinL1(value) Returns the arcsine of a real number, expression, or list. |
y ? |
|
|
|
|---|---|
|
sinh(value) Returns the hyperbolic sine of a real number, expression, or list. |
y N |
|
|
|
|---|---|
|
sinhL1 (value) Returns the hyperbolic arcsine of a real number, expression, or list. |
y N |
|
|
|
|---|---|
|
SinReg [iterations,Xlistname,Ylistname,period,regequ] Attempts iterations times to fit a sinusoidal regression model to Xlistname and Ylistname using a period guess, and stores the regression equation to regequ. |
… |
|
|
|
|---|---|
|
solve(expression,variable,guess,{lower,upper}) Solves expression for variable, given an initial guess and lower and upper bounds within which the solution is sought. |
† » |
|
|
|
|---|---|
|
SortA(listname) Sorts elements of listname in ascending order. |
y 9 |
|
SortA( |
|
|---|---|
|
SortA(keylistname,dependlist1[,dependlist2,...,dependlist n]) Sorts elements of keylistname in ascending order, then sorts each dependlist as a dependent list. |
y 9 |
|
|
|
|---|---|
|
Sorts elements of listname in descending order. |
y 9 |
|
SortD( |
|
|---|---|
|
SortD(keylistname,dependlist1[,dependlist2,..., dependlist n]) Sorts elements of keylistname in descending order, then sorts each dependlist as a dependent list. |
y 9 |
|
|
|
|---|---|
|
startTmr Starts the clock timer. Store or note the displayed value, and use it as the argument for checkTmr( ) to check the elapsed time. |
y N |
|
|
|
|---|---|
|
STATWIZARD OFF Disables wizard syntax help for statistical commands, distributions, and seq(. |
y N |
|
|
|
|---|---|
|
STATWIZARD ON Enables wizard syntax help for statistical commands, distributions, and seq(. |
y N |
|
|
|
|---|---|
|
stdDev(list[,freqlist]) Returns the standard deviation of the elements in list with frequency freqlist. |
y 9 |
|
|
|
|---|---|
|
Stop Ends program execution; returns to home screen. |
† ¼ |
|
|
|
|---|---|
|
Store: value!variable Stores value in variable. |
¿ |
|
|
|
|---|---|
|
StoreGDB n Stores current graph in database GDBn. |
y < |
|
|
|
|---|---|
|
Stores current picture in picture Picn. |
y < |
|
|
|
|---|---|
|
String4Equ(string,Y= var) Converts string into an equation and stores it in Y= var. string can be a string or string variable. String4Equ( is the inverse of Equ4String(. |
† ¼ |
|
|
|
|---|---|
|
sub(string,begin,length) Returns a string that is a subset of another string, from begin to length. |
y N |
|
|
|
|---|---|
|
sum(list[,start,end]) Returns the sum of elements of list from start to end. |
y 9 |
|
summation G( |
|
|---|---|
|
G(expression[,start,end]) Classic command as shown. In MathPrint™ the summation entry template displays and returns the sum of elements of list from start to end, where start <= end. |
» NUM 0: summation G( |