|
Module 15 - Answers
|
|
|
|
Lesson 1
|
|
|
|
Answer 1
|
|
|
|
15.1.1 The particle appears to be moving right for values of t in the intervals (0, 1) and (2, 4).
|
|
|

|

|
|
Answer 2
|
|
|
|
15.1.2 The particle appears to be moving left for values of t in the interval (1, 2).
|
|
|

|

|
|
Answer 3
|
|
|
|
15.1.3 The particle appears to change direction at t = 1 and t = 2.
|
|
|

|

|
|
Answer 4
|
|
|
15.1.4 On the graph where the y-values indicate time, the turning points show when the particle changes direction.
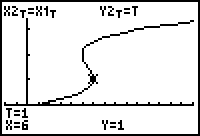
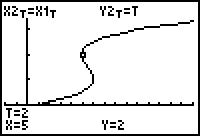
The particle appears to change direction at t = 1 and at t = 2, as shown by using the Trace feature on the graph defined in X2T, Y2T.
|
|
|

|

|
|
Answer 5
|
|
|
|
15.1.5 When the position graph is increasing, the derivative graph is positive and the particle is moving right. When the position graph is decreasing, the derivative graph is negative and the particle is moving left. When the position graph changes from increasing to decreasing or from decreasing to increasing, the derivative graph changes from positive to negative or from negative to positive and the particle is momentarily at rest.
|
|
|

|

|
|
Lesson 2
|
|
|
|
Answer 1
|
|
|
|
15.2.1 The speed of the animation slows down.
|
|
|

|

|
|
Answer 2
|
|
|
|
15.2.2 The particle is moving upward during the intervals (0, 0.75) and (2.25, 3.75).
|
|
|

|

|
|
Answer 3
|
|
|
|
15.2.3 The particle is moving downward during the intervals (0.75, 2.25) and (3.75, 5).
|
|
|

|

|
|
Answer 4
|
|
|
|
15.2.4 The particle is momentarily at rest at t = 0.75, 2.25, and 3.75 seconds.
|
|
|

|

|
|
Answer 5
|
|
|
|
15.2.5 When the velocity (derivative) is zero the particle is momentarily at rest. This first happens at t = 0.75.
|
|
|

|

|
|
Answer 6
|
|
|
|
15.2.6 When the velocity is positive the particle is moving upward, and when the velocity is negative the particle is moving downward.
|
|
|

|

|
|
Lesson 3
|
|
|
|
Answer 1
|
|
|
|
15.3.1 Recall that X1T represents the horizontal distance of the ball from home plate and Y1T represents the ball's height.
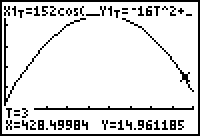
Because the ball is almost 15 feet above ground at a distance of 428 feet, it will easily clear a 10-foot fence at 415 feet.
|
|
|

|

|
|
Answer 2
|
|
|
|
15.3.2
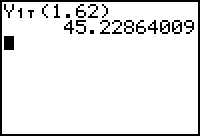
The maximum height is slightly more than 45 feet.
|
|
|

|

|
|
Answer 3
|
|
|
|
15.3.3
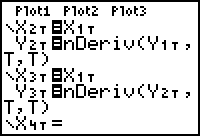
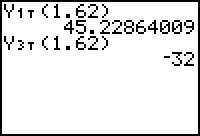
Because the second derivative is negative at t = 1.62 and the first derivative is zero there, the function has a local maximum there.
|
|
|

|

|
|
Self Test
|
|
|
|
Answer 1
|
|
|
|
Set X1T = T^3-11T^2+38T-30, Y1T = 0 and use the Animated (
 ) Graph style.
|
|
|
|
Answer 2
|
|
|
|
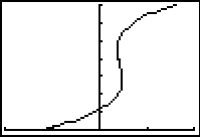
Set X1T = T^3-11T^2+38T-30, Y1T = T and use the Path (
 ) Graph style.
The graph is shown in Path graphing style in a [0, 7, 0.1] x [-50, 50, 25] x [0, 7, 1] window.
|
|
|
|
Answer 3
|
|
|
|
The particle's position when it is furthest to the left is 30 units left of the origin, i.e., at -30. This happens at t = 0.
|
|
|
|
Answer 4
|
|
|
|
The particle is moving right during the approximate time intervals (0, 2.78) and (4.55, 7).
|
|
|
|
Answer 5
|
|
|
|
The particle is moving left during the approximate time interval (2.78, 4.55).
|
|
|
|
Answer 6
|
|
|
|
The particle is at rest at approximately 2.78 seconds and 4.55 seconds after it began to move, i.e., t = 2.78 and t = 4.55.
|
|
|
|
Answer 7
|
|
|
|
The motion of the ball may be modeled by X1T = 138*T*cos(30), Y1T = -16T^2+138*T*sin(30)+3.5
|
|
|
|
Answer 8
|
|
|
|
The ball will hit the ground about 521 feet away from home plate after approximately 4.36 seconds.
|
|
|
|
Answer 9
|
|
|
|
The maximum height of the ball is approximately 77.89 ft.
|
|
|

|
©Copyright
2007 All rights reserved. |
Trademarks
|
Privacy Policy
|
Link Policy
|


![]() ) Graph style.
) Graph style.
![]() ) Graph style.
) Graph style.
