Statistics
With TI-Nspire Technology you can:
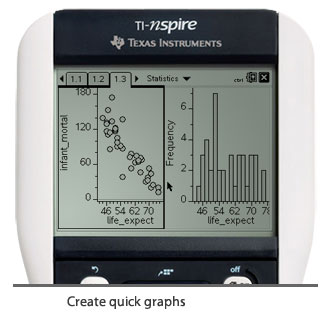
Create quick graphs of one- and two-variable data sets that can be analyzed and manipulated in real time.
Manipulate data points and observe changes to a regression equation, histogram, and box plot simultaneously.
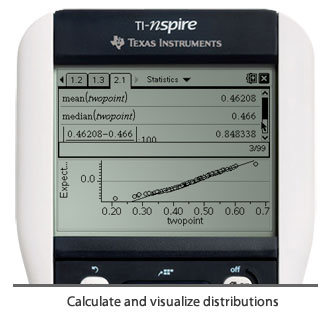
Calculate and visualize distributions, such as binomial and normal distributions.