This lesson investigates finding the definite integral
The limit of a Riemann sum as the number of rectangles approaches infinity is called a definite integral. The notation used to represent a definite integral is
![]() and for non-negative functions it represents the exact area under f(x) and above the x-axis between x = a and x = b.
and for non-negative functions it represents the exact area under f(x) and above the x-axis between x = a and x = b.
There are two features on the TI-89 that evaluate a definite integral:
- The integral key
- The definite integral feature of the Graph screen's Math menu
Using The Integral Key
Find the exact area under the curve f(x) = x2 and above the x-axis between x = 0 and x = 1 by using the integral key to evaluate
![]() .
.
- Execute NewProb and be sure that the calculator is in AUTO mode.
- Define f(x) = x2
-
Clear the Home Screen by pressing


-
Paste the
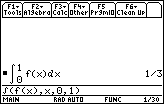
integral function to the Edit Line by pressing

The syntax for finding a definite integral using the integral function is  (expression, var, lower, upper)


-
Enter
 [F]
[F]


.gif)


.gif)

![]() is a second feature above the
is a second feature above the
![]() key.
key.

This is the same value found in the previous lessons by taking the limit using both right- and left-hand rectangles.
15.3.1 Evaluate
![]() by using the definite integral key and interpret the result.
by using the definite integral key and interpret the result.
Click here for the answer.
Using the Graphical Definite Integral
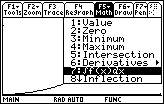
Another way to evaluate a definite integral is by graphing the function and using the
![]() function found in the Math menu of the Graph screen.
function found in the Math menu of the Graph screen.
- Graph y1=x2 in the window [0, 1] x [-0.2, 1]
|
|||
|
|
|||
-
Select 7:
 from the Math menu

- When prompted, enter 0 for the lower limit and 1 for the upper limit
Typing the value and pressing
![]() is a quick way to set a limit.
is a quick way to set a limit.

This feature shades the area and gives a decimal approximation of the integral. The type of shading varies from one use to the next so the shading on your screen will likely be different from that in the screen shot above.
15.3.2 Find the area under the curve g(x) = 2x + 1 between x = 0 and x = 3 by using the graphical definite integral function in the Math menu of the Graph screen. Use the window [0, 3] x [-2, 10].
Click here for the answer.