In this lesson you will use the tanimate program and the Inflection feature in the Graph Math menu to determine characteristics of a function by looking at the graph of its second derivative.
Defining the Second Derivative
If f is a function, then we have seen that its derivative, f ', is also a function. The function f ' may have its own derivative. The derivative of f ' is called the second derivative of f.
The second derivative of the function f is denoted by f " , which is read "f double prime." The calculator denotes a second derivative as
![]() , which is an alternate notation.
, which is an alternate notation.
Visualizing How the Tangent Line Slopes Change
To visualize the relationship between a function and its second derivative, graph a function, run tanimate, and watch the creation of tangent lines with a new focus.
-
Graph y1 = sin 2x in a [-1.7, 1.7] x [-1.2, 2] window.
Be sure that radian mode is selected.
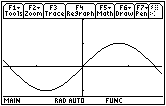
Notice that the tangent lines have positive slopes on the interval
![]() , but there is another feature of the tangent lines on this interval that is also important. It concerns how the slopes of the tangent lines change from one point to the next, which the program tanimate can illustrate. The final graph produced by tanimate does not illustrate this concept, but watching the dynamic process of the animated tangent lines may.
, but there is another feature of the tangent lines on this interval that is also important. It concerns how the slopes of the tangent lines change from one point to the next, which the program tanimate can illustrate. The final graph produced by tanimate does not illustrate this concept, but watching the dynamic process of the animated tangent lines may.
- Run the TI-89 program tanimate
- Select "Animated" in the first dialog box
- Select "MEDIUM" in the second dialog box
- Select "TANGENT&PTS" in the third dialog box
-
Enter -
 /4 for the left endpoint and
 /4 for the right endpoint
While the program is running watch the tangent lines carefully and pay attention to how the tangent line slopes are changing from one point to the next.
9.2.1 Describe how the slopes of the tangent lines change. Click here for the answer.
Defining Concavity
The graph of a function is said to be concave upward on an interval where the slopes of the tangent lines increase and concave downward where the slopes of the tangent lines decrease. That is, concavity is a measure of whether a curve is turning upward or downward.
Determining the Concavity of f from the Graph of f "
The graph of the second derivative of y = sin 2x can be found by using the
![]() key.
key.
-
Graph y2=d(y1(x),x,2) in a [-1.7, 1.7] x [-4, 4] window
Including the "2" as a third argument in the derivative command indicates the second derivative.
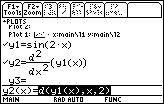
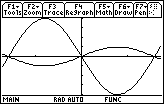
9.2.2 What is the relationship between the second derivative and the original function? Approximate where the graph of y = sin 2x shown above changes from concave upward to concave downward? Click here for the answer.
Finding an Inflection Point
A point where a function's graph changes concavity is called an inflection point. You can find this point with the Inflection feature in the Graph Math menu.
-
Open the Math menu by pressing

- Select 8:Inflection
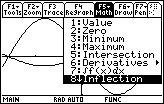
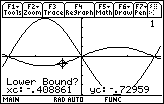
Make sure you are on the right graph. There should be a "1" in the upper right corner of the screen. The calculator prompts you for a lower bound.
- Move the cursor until it is slightly to the left of the estimated inflection point
-
Select the desired point by pressing

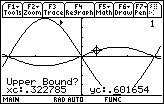
- Move the cursor until it is slightly to the right of the estimated inflection point
-
Select the desired point by pressing

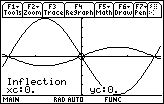
The function y = sin 2x has an inflection point at (0,0).
Finding the Inflection Point of Another Function
Find the inflection point of the function given in Lesson 9.1: y = x3 – 2x2 – 5x + 6 .
- Graph y = x3 – 2x2 – 5x + 6 in a [-5, 5] x [-10, 10] window
- Find the inflection point by using the Inflection feature
9.2.3 What are the coordinates of the inflection point? Click here for the answer.