In this lesson you will investigate sequences using the TI-83's features. You will also explore when a sequence converges by viewing the graph of a sequence and the table of associated values.
Defining a Sequence
A sequence is a function whose domain is restricted to the set of positive integers or, in some cases, the set of nonnegative integers. The numerical representation for a sequence is a list or table of values and the graphical representation is a set of discrete points. There are several features on a TI-83 that are useful in creating these representations.
Using the Sequence Command
The sequence command can be used to create a list of a finite number of terms from a sequence.
|
|||
|
|
|||
Finding the Terms of a Sequence
Find the first ten terms of the sequence defined by
![]() , where an represents the value of the nth term of the sequence. Recall that the symbol "!" represents the
, where an represents the value of the nth term of the sequence. Recall that the symbol "!" represents the
factorial of the preceding number.
![]()
![]()
The factorial of a whole number is the product of the series of consecutive whole numbers that begins with 1 and ends with the number: 6! = 1x2x3x4x5x6. 0! is defined to be 1.
![]()
![]()
-
Open the LIST OPS menu by pressing
 [LIST]
 .
.
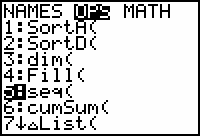
The fifth option in this menu is 5:seq(, the sequence command.
-
Paste this command to the Home Screen by pressing
 .
.
- Complete the command seq(2^N/N!, N, 1, 10).
The factorial symbol, !, which is the fourth option in the PRB submenu of the MATH menu, is accessed by pressing
![]()
![]()
![]()
![]()
![]() . The factorial symbol can also be found in the Catalog.
. The factorial symbol can also be found in the Catalog.
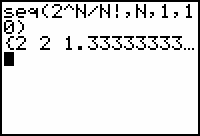
The command generates a list containing the first 10 terms in the sequence. Move the cursor to the right by using the right arrow key to see the hidden part of the list.
-
Convert the list to fractions by pressing


 .
.
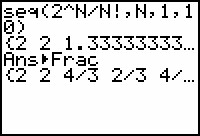
|
|||
|
|
|||
23.1.1 Describe the behavior of the sequence generated by
![]() as n gets large.
as n gets large.
Click here for the answer.
Defining Convergence
If the terms of the sequence have a limit as n approaches infinity, the sequence is said to converge to the value of the limit. The sequence defined by
![]() converges to 0 as suggested by the result in Question 23.1.1.
converges to 0 as suggested by the result in Question 23.1.1.
If the sequence grows without bound or the values jump around or oscillate and do not approach a single value, the sequence is divergent. A sequence may oscillate and converge if the oscillations become small and the values approach a single value.
Graphing Sequences
Convergence of a sequence may be illustrated by using the TI-83 Sequence Graphing mode to display the graph of the sequence.
|
|||
|
|
|||
-
Select Sequence Graphing mode by pressing
 and highlighting Seq. Also select Dot graphing mode.
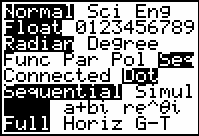
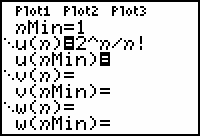
- Enter the expression 2^n/n! in the Y= editor.
- Enter the Window parameters shown below.
Descriptions of the new parameters are given in the first column.
| Beginning value of n | nMin = 1 | Xmin = 0 | Ymin = -1 |
| Ending value of n | nMax = 10 | Xmax = 11 | Ymax = 3 |
| Where the plot starts | PlotStart = 1 | Xscl = 1 | Yscl = 1 |
| The increase in n from one point to the next | PlotStep = 1 |
|
|||
|
|
|||
-
Display the graph of the first 10 terms of the sequence by pressing
 .
.
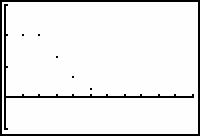
TRACE the terms of the sequence by pressing
![]() .
.
23.1.2 What feature of the graph indicates that the sequence converges?
Click here for the answer.
A Table of Values
A sequence that is defined in the Y= Editor can also be displayed in a table.
-
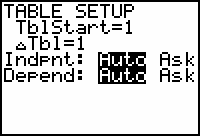
Open the Table Setup dialog box by pressing
 [TBLSET] and set both TblStart and
 Tbl to 1.
-
Press
 [TABLE] to create the table.
- Use the cursor movement keys to scroll down the table.
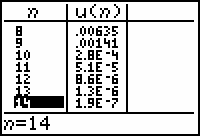
As you scroll down the table, the values of u(n) get smaller and smaller, which is numerical evidence that the sequence converges to zero. Notice that we are not forced to choose a maximum value for n to display the table.
23.1.3 Does the sequence
![]() converge? Provide graphical and numerical evidence for your conclusion.
converge? Provide graphical and numerical evidence for your conclusion.
Click here for the answer.