In Module 10 we saw that the value of the derivative of a function at x is given by the slope of the line tangent to the graph of f at x. In this lesson you will explore what the first derivative says about the graph of the original function by using the Derivative and Tangent features of the TI-83.
As noted earlier, the first derivative of a function f is denoted by f ', which is read "f prime." An alternate notation for the derivative is
![]() , or simply df(x)/dx. The value of the first derivative at
, or simply df(x)/dx. The value of the first derivative at
Using the Derivative Feature on the Graph Screen
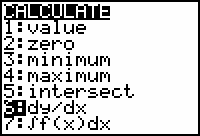
The TI-83 has several features that can be used to approximate the derivative of a function. The Derivative feature of the Graph screen's CALCULATE menu can be used to estimate a derivative.
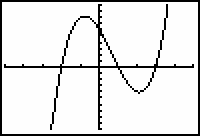
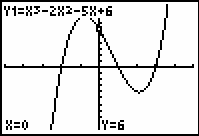
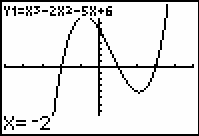
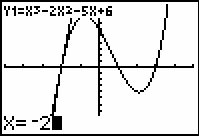
- Graph f(x) = x3 - 2x2 -5x + 6 in a [-5, 5, 1] x [-10, 10, 1] window.
-
Activate the Derivative feature in the CALCULATE menu by pressing
 [CALC] and selecting 6:dy/dx.
-
Enter -2 as the x-coordinate by pressing
.gif)
 .
.
-
Set the value of the x-coordinate by pressing
 .
.
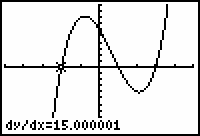
The value of the derivative of f(x) = x3 - 2x2 - 5x + 6 at x = -2 appears to be approximately 15. That is,
![]() .
.
Using the Tangent Feature
The Tangent feature in the Draw menu can also be used to approximate the derivative of a function at a given point because it graphs the tangent line at the point and displays the equation for that tangent line.
-
From the Graph screen open the Draw menu by pressing
[DRAW].
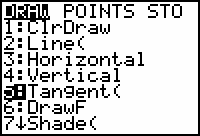
- Select 5:Tangent(.
After you make the selection, you should see the graph of the function.
-
Enter -2 for the x-coordinate of the point of tangency and then press
.
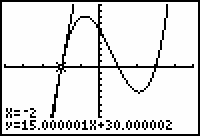
The TI-83 displays the graph of the tangent line and shows its equation at the bottom of the screen. The equation of the tangent line in the example above is approximately y = 15x + 30.
|
|||
|
|
|||
11.1.1 What part of the equation of the tangent line to the curve at x = -2 represents the value of the derivative at that point? Explain. Click here for the answer.
11.1.2 The table below contains x-values of points on the graph of the function f(x) = x3 - 2x2 - 5x + 6. Determine each corresponding value for f(x) and use the Derivative feature to find an approximate value for the derivative at each point. Record the values.
Click here for the answer.
- Redraw the graph and clear the tangent line by selecting ClrDraw from the Draw menu.
11.1.3 Use the graph of the function and the table you just completed to answer the following questions.
- What do you notice about the values of the derivative on the intervals where the function is decreasing?
- What do you notice about the values of the derivative on the intervals where the function is increasing?
Click here for the answer.
Finding Turning Points from the Derivative
If a function is differentiable at one of its
turning points, the value of the derivative must be zero at that point. Graphing the derivative and the function on the same screen illustrates how to find these turning points.
![]()
![]()
A turning point of the graph of a function is a point where the function changes from increasing to decreasing or changes from decreasing to increasing.
![]()
![]()
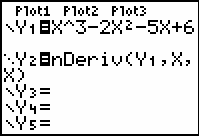
The Numerical Derivative, which is found in the Math menu, can be used to graph the derivative of a function defined in the Y= editor. The syntax for the Numerical Derivative is
To graph the derivative, designate the function defined in Y1 as the expression with X as the variable. The point where nDeriv is computed needs to be the graphing variable X, so the expression shown below muse be entered on the Y= screen.
- Set Y2 = nDeriv(Y1,X,X)
-
Set the graphing style of Y2 to "dot" by moving the cursor left of the "=" sign and pressing
six times.
-
Display the graph of the function and its derivative by pressing
 .
.
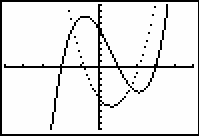
The function is increasing exactly where the derivative is positive and decreasing exactly where the derivative is negative. The zeros of the derivative function identify the endpoints of the intervals of interest.
On the graph of the derivative find the x-value of the zero that is left of the origin.
- Select the Zero feature in the Graph screen's CALCULATE menu.
-
Move the cursor to the graph of the derivative by pressing
 .
.
Y2 should appear in the upper left-hand corner indicating that the graph defined in Y2 is selected. -
Set the lower bound by moving the cursor to the left of the desired zero and pressing
.
-
Set the upper bound by moving the cursor to the right of the desired zero and pressing
.
-
Select an initial guess by moving the cursor close to the zero and pressing
.
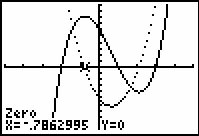
One of the zeros of the derivative is approximately x = -0.7863. We have therefore found the x-coordinate of a turning point.
11.1.4 Find the other zero of the derivative using the Zero feature of the Graph screen's CALCULATE menu. Click here for the answer.
Summarizing the Relationship Between f and f '
The following characteristics of the function f(x) = x3 - 2x2 - 5x + 6 can be determined from the graph of its first derivative.
-
The derivative is zero at x
 -0.7863 and at x
2.11963. These are the x-coordinates of the turning points of the function f(x) since the sign of the derivative changes at these points.
-0.7863 and at x
2.11963. These are the x-coordinates of the turning points of the function f(x) since the sign of the derivative changes at these points.
-
The function is increasing on the intervals
 and
and
 . The first derivative is positive on these intervals.
- The function is decreasing on the interval (-0.7863, 2.1196). The first derivative is negative on this interval.