In Lesson 4.1 you graphed a function and its inverse relation parametrically. In this lesson you will use the same method to graph the inverse relation of a sine function. By restricting the values of Tmin and Tmax you will define the inverse relation so it is a function, also.
Inverse Sine
Explore the inverse of the sine function by simultaneously graphing the sine function and its inverse using parametric equations.
- Turn off any active scatter plots.
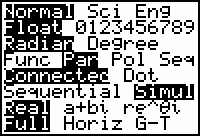
- Select the Parametric and Simultaneous modes in the MODE menu.
-
Clear any equations in the Y= editor and enter the sine function,
 , and its inverse function,
 , making the sine function thicker.
-
Display the graphs in a [-2
 , 2
, 2
 , 0.1] x [-9.5, 9.5, 1] x [-2
 , 2
, 2
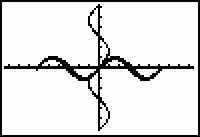
 , 1] window.


Notice that as the sine function waves about the x-axis, its inverse waves about the y-axis. Because there is more than one y-value associated with some x-values, the inverse relation is not a function.
Restricting the Domain of Sine
The inverse of the sine function is not a function. But if you restrict the domain of the sine function so that each y-value in [-1, 1] occurs only once, then the inverse of this restricted function will also be a function.
-
Change the values of Tmin and Tmax to the values shown below.


- Display the graphs of both the sine function and it's inverse again but use regular line style for the sine function

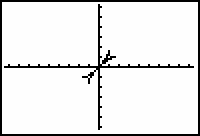
The inverse of this restricted function is a function, however the viewing window is not a good one.
-
Enter the following window values:

Display only the inverse function by unselecting X1T and Y1T , as described below.
-
Press
 then move the cursor onto the "=" sign beside X1T and press
 .
.
The "=" signs for X1T and Y1T should no longer be highlighted. This means X1T and Y1T are no longer selected for graphing and will not be displayed.
-
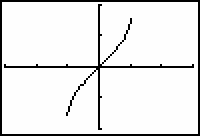
Display the graph of the inverse sine by pressing


Restricting the domain of y = sin(x) also restricted the range of the inverse relation, which forced each input of the inverse to have exactly one output. The resulting inverse is the function y = sin-1x , which is also written as y = arcsin x.
|
|||
|
|
|||