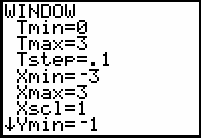
The points are only evaluated and plotted for values of t greater than or equal to zero. Because x = t, only values of x that are greater than or equal to zero will be graphed.

The inverse of the parabola is a parabola that is symmetric with respect to the x-axis and is the reflected image of the original parabola across the line y = x. The original parabola and its inverse relation, the thicker graph, are shown below in a [-3,3] x [-3, 3] window.

The graphs of y = (x - 3)2 and it's inverse are reflections of one another across the line y = x. The thicker graph below is the graph of y = (x - 3)2, the thinner graph is the graph of its inverse relation, and the dotted line is y = x.
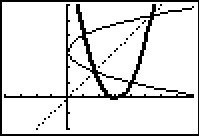
The inverse relation is not a function.
The graph is a circle of radius one centered at the origin.
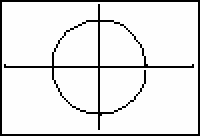
Points being plotted simultaneously on both the unit circle and the sine wave have the same y-values.
The graph of y = -3sin(2(x + 1)) - 4 is the graph of y = sin x that has been:
Reflected across the x-axis.
Vertically stretched by a factor of 3 (the amplitude is 3).
Compressed Horizontally by a factor of 1/2, that is, the new period is
![]() .
.
Horizontally shifted left 1.
Vertically shifted down 4.
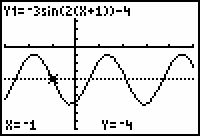
The new graph would have a smaller period so the peaks would be closer together.
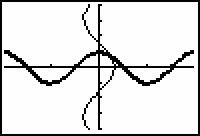
The window shown is [-2
![]() , 2
, 2
![]() , 0.2] x [-2
, 0.2] x [-2
![]() , 2
, 2
![]() ,
,
![]() /2] x [-4, 4, 1].
/2] x [-4, 4, 1].
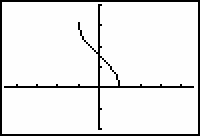
The window shown is [0,
![]() , 0.1] x [-4.5, 4.5, 1] x [-2, 4, 1]
, 0.1] x [-4.5, 4.5, 1] x [-2, 4, 1]
Reflected over the x-axis
Vertical stretched by a factor of 2 (amplitude = 2)
Horizontal shrunk by a factor of
![]() , making the period 4
, making the period 4
Horizontal shifted right 3
Vertical shifted up 1
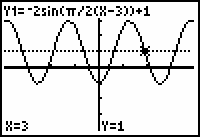
The window shown was determined by selecting 7:ZTrig in the ZOOM menu. The dotted line is y = 1 and the cursor indicates a shift up 1 and right 3 from the origin.
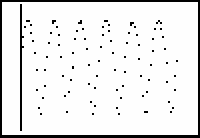

-
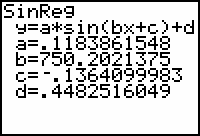
The frequency of the alternating current that produced the light was 60 cycles per second. For each cycle in the alternating current the light would peak once as the current flowed one way and again as the current flowed the other way, or twice per cycle of the alternating current. Therefore, the frequency was about 120 cycles per second, which was confirmed by the regression equation.
©Copyright 2007 All rights reserved. | Trademarks | Privacy Policy | Link Policy