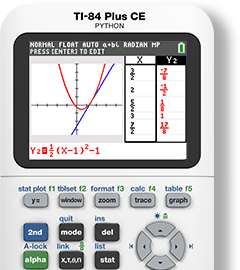
Introducing the
new TI-84 Evo
The best in the TI-84 series — easier to use, student-friendly and made for performance.
Discover TI-84 Evo


Made for math. Built for learning. That's your TI.
Texas Instruments graphing calculators are the gold standard for classrooms everywhere — designed to keep students focused in class, build confidence for test day, and help teachers make math make sense.
The calculators you want
for exams
TI graphing and scientific calculators are approved for use on most college entrance, high-stakes and state tests.


Find the calculator right for you
Take a look at the comparison charts to see what’s approved for exams, course listings and key features.
Find your calculatorMore learning, less distraction
No internet. No social media.
No distractions to take them away from what's
Teachers worry less about cheating and focus

New hues for you
The coolest calculators in the coolest colors.

Did you know?
We have online and computer versions of our most popular calculators.
Tons of teacher resources
Not a math teacher? Choose your subject.
Science
Computer Science

One calculator for math, science and more
A one-time investment in a TI graphing calculator provides a smart, cross-curricular solution that follows students from middle grades and high school to college.
Are you a school or district leader? Contact your local TI representative to discuss the best solutions to meet your unique needs.
Find my rep
Professional development for teachers by teachers
Enhance teaching practices and gain valuable skills using TI technology.
Explore learning opportunitiesWhat Teachers Are Saying

@Math_in_Motion
Math Curriculum Specialist from California
“I love that [the TI-84 Plus CE] provides opportunities for students to feel excited about math, do ‘math’ and actually feel as if math means something in the real-world.”

@gisellearissa
High School Teacher from Nova Scotia
“I’ve been using a TI-84 for over 12 years! It’s one of my life comforts at this point, no other calculator will do! I love showing student statistics on them! The sorting lists and making histograms are always hits!!”

@MsRlovesMath
Math Teacher from Virginia
“I love how easy it is to use a TI and how easy it is to do regression (especially compared to the one my state uses for state testing).”
BulleTIn Board Blog

TI Calculator Tips for the Enhanced ACT
Read more
Bloom With These 5 Springtime Math Resources
Read more
Simple and Easy Calculator Tips for Algebra 2 Concepts
Read more
7 Important Calculator Functions Algebra 1 Students Need
Read more
Top 6 Calculator Functions You Need To Know for AP® Statistics
Learn more
Helpful AP® Precalculus Resources Teachers Will Love
Read moreJust the facts

#1 brand of graphing calculator recommended by teachers in the U.S.

TI graphing calculators are accepted on more than 60 high-stakes exams worldwide.

25 million students around the globe use a TI calculator.